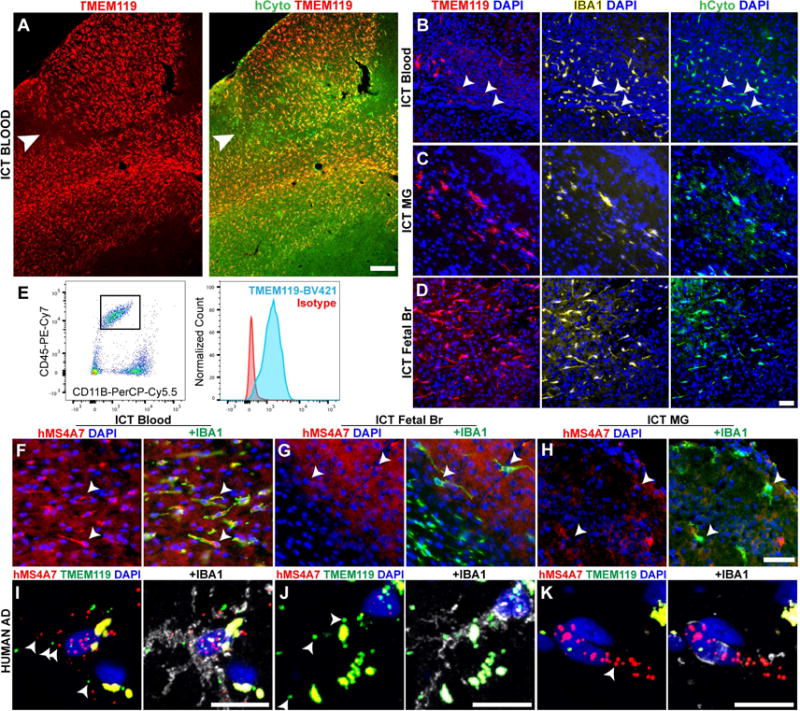
Figure 7. Macrophage transplantation, origin markers, and anti-TMEM119 monoclonal antibodies for the study of primary human macrophages in vivo.

A) Pervasively engrafted TMEM119+ (red) cells from human blood in the Rag2−/−Il2rg−/−hMCSF+/+Csf1r−/− brain parenchyma, co-stained with human cytoplasm marker (hCyto, green). Arrowhead indicates TMEM119- cells at edge of engraftment territory. Scale bar = 200μm. (B-D) Representative images of MLCs from human blood (B), adult microglia (C), and cultured fetal brain (D), immunostained for human TMEM119 (red), IBA1 (yellow) and human cytoplasmic marker (green). Arrowheads in (B) identify human TMEM119 low/- cells. Scale bar = 50μm. (E) A custom anti-human TMEM119 antibody identifies CD45+/CD11B+ fetal human MLCs 14 days after transplantation into the mouse CNS. Tmem119 staining (blue) is shown compared to isotype control (red). (F-H) Representative images of MLCs from blood (F), fetal brain (G) and primary human microglia (H) immunostained for human MS4A7 (red) and IBA1 (green). Arrowheads (B,F-H) mark location IBA1+ cell bodies. Scale bar = 100μm. (I-K) Representative images from RNA in situ hybridization of post-mortem Alzheimer’s disease brain samples, showing (I) rare MS4A7+(red)/TMEM119+(green)/IBA1 protein+ (white) macrophages, (J) abundant MS4A7-/TMEM119+/IBA1+ macrophages, and (K) MS4A7+/TMEM119-/IBA1+ perivascular macrophages. Arrowheads show examples of positive puncta, given abundant autofluorescent signal (puncta in perfect registration) Scale bars = 12.5μm. See also Figure S7.
