
Fig. 4.
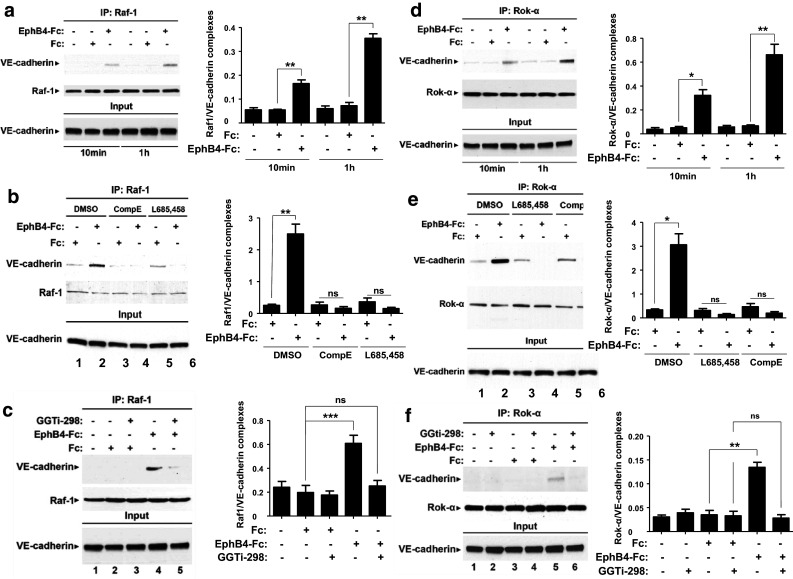
EphB4-Fc increases the Raf-1/VE-cadherin and Rok-α/VE-cadherin complexes in a γ-secretase- and Rap1-dependent manner. a Left: BAMECs were treated with 2 μg/ml EphB4-Fc or Fc for the indicated times. Cells were lysed in 1%(v/v) TX-100 in the presence of protease inhibitors and extracts were IPed with anti-Raf-1 antibodies. IPs were probed on WB with anti-VE-cadherin (upper panel) or anti-Raf-1 (lower panel) antibodies. EphB4-Fc increases the Raf-1/VE-cadherin complexes (lanes 3, 6). Right: Bar graph shows quantification of results. Paired t test, n = 4, **p < 0.01, error bars = SEM. b Left: cells were treated with 2 μg/ml EphB4-Fc or Fc for 1 h in the presence or absence of γ-secretase inhibitors L685,458 (1 μM) or Compound E (1 μM) added 3 h prior to EphB4-Fc. Cells were lysed and IPed as in a. EphB4-Fc-induced increase in Raf-1/VE-cadherin complexes (lane 2) was inhibited by both γ-secretase inhibitors (lanes 4,6). Right: bar graph shows quantification of results. Paired t test, n = 4, **p < 0.01, error bars = SEM. c Left: cells were treated with 2 μg/ml Fc or EphB4-Fc in the presence or absence of 0.5 μM Rap1 inhibitor GGTi-298 as indicated in the figure. Cell extracts were IPed as in a. Rap1 inhibitor strongly inhibits EphB4-Fc-induced complexes between Raf-1 and VE-cadherin. Right: bar graph shows quantification of results. Paired t test, n = 4, ***p < 0.001, error bars = SEM. d Left: cells were treated with 2 μg/ml EphB4-Fc or Fc for the indicated times. Cells were lysed in TX-100 and extracts were IPed with anti-Rok-α antibodies. IPs were probed on WB with anti-VE-cadherin (upper panel) or anti-Rok-α (middle panel) antibodies. EphB4-Fc increases the VE-cadherin/Rok-α complexes (lanes 3 and 6) compared to Fc (lanes 2 and 5). Right: bar graph shows quantification of results. Paired t test, n = 4, *p < 0.05, **p < 0.01, error bars = SEM. e Left: cells were treated with γ-secretase inhibitors L685,458 (1 μM) or Compound E (1 μM) as above or DMSO for 3 h and then treated with 2 μg/ml EphB4-Fc or Fc for 1 h. Cell extracts were lysed and IPed as in d. EphB4-Fc-induced Rok-α/VE-cadherin complexes (lane 2) were inhibited by both inhibitors (lanes 4,6). Right: bar graph shows quantification of results. Paired t test, n = 4, *p < 0.05, error bars = SEM. f Left: cells were treated as in c and cell extracts were IPed as in d. Rap1 inhibitor strongly inhibits EphB4-Fc-induced complexes between Rok-α and VE-cadherin. Right: bar graph shows quantification of results. Paired t test, n = 4, **p < 0.01, error bars = SEM