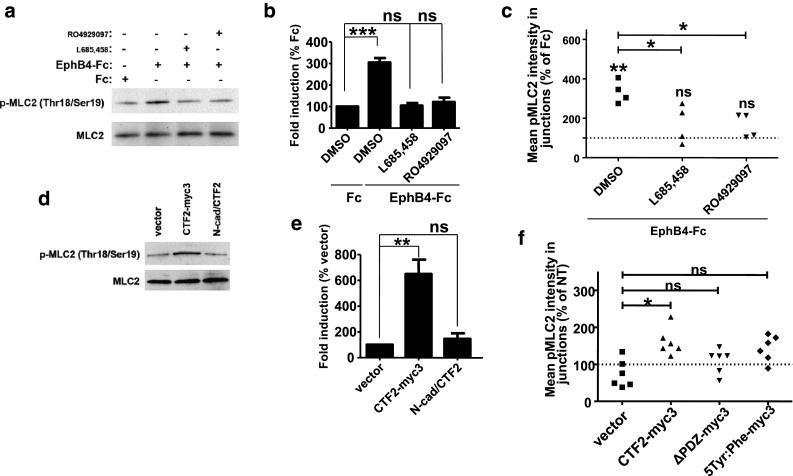
Fig. 7.

EphB4-Fc increases phosphorylation of p-MLC2 at VE-cadherin-containing cell–cell contact sites in a γ-secretase-dependent manner. a BAMECs were treated with 2 μg/ml Fc or EphB4-Fc for 10 min in the presence or absence of 1 μM L685,458 or 100 nM RO 4929097. Cells were extracted in 1% SDS buffer and p-MLC2 and MLC2 were detected in cell extracts with WB using anti-p-MLC (Thr18/Ser19) and anti-MLC2 antibodies, respectively. b Densitometric quantification of the WB bands showed statistically significant increase in p-MLC2 after EphB4-Fc treatment, an increase that was inhibited by both γ-secretase inhibitors. Paired t test, n = 3, ***p < 0.001, error bars = SEM. c Cells were grown on glass coverslips and treated with Fc, EphB4-Fc and γ-secretase inhibitors as above. VE-cadherin and p-MLC2 were detected by immunostaining with specific antibodies. Intensity of p-MLC2 colocalizing with VE-cadherin at cell–cell contact sites was measured in images obtained with a Zeiss confocal laser scanning microscope (see Fig. S5). EphB4-Fc significantly increases p-MLC2 at VE-cadherin cell–cell contact sites and γ-secretase inhibitors inhibit that function of EphB4-Fc. Paired t test, n = 3, *p < 0.05, **p < 0.01, error bars = SEM. WT but not mutant efnB2/CTF2 increases phosphorylation of p-MLC2 at VE-cadherin-containing cell–cell contact sites. d BAMECs were transduced with efnB2/CTF2-myc3 or N-cad/CTF2 or vector alone. Cells were extracted in 1% SDS buffer and p-MLC2 and MLC2 were detected in cell extracts with WB using anti-p-MLC (Thr18/Ser19) and anti-MLC2 antibodies, respectively. e Densitometric quantification of the WB bands showed statistically significant increase in p-MLC2 in efnB2/CTF2-myc3 expressing cells but not in N-cad/CTF2 expressing cells. Paired t test, n = 3, **p < 0.01, error bars = SEM. f Cells transduced with WT or mutant efnB2/CTF2 were grown on glass coverslips. VE-cadherin and p-MLC2 were detected by immunostaining with specific antibodies. Intensity of p-MLC2 colocalizing with VE-cadherin at cell–cell contact sites was measured as described (Fig. S5). efnB2/CTF2-myc3 but not mutant CTF2 overexpression significantly increases p-MLC2 at VE-cadherin cell–cell contact sites. Paired t test, n = 3, *p < 0.05, error bars = SEM
