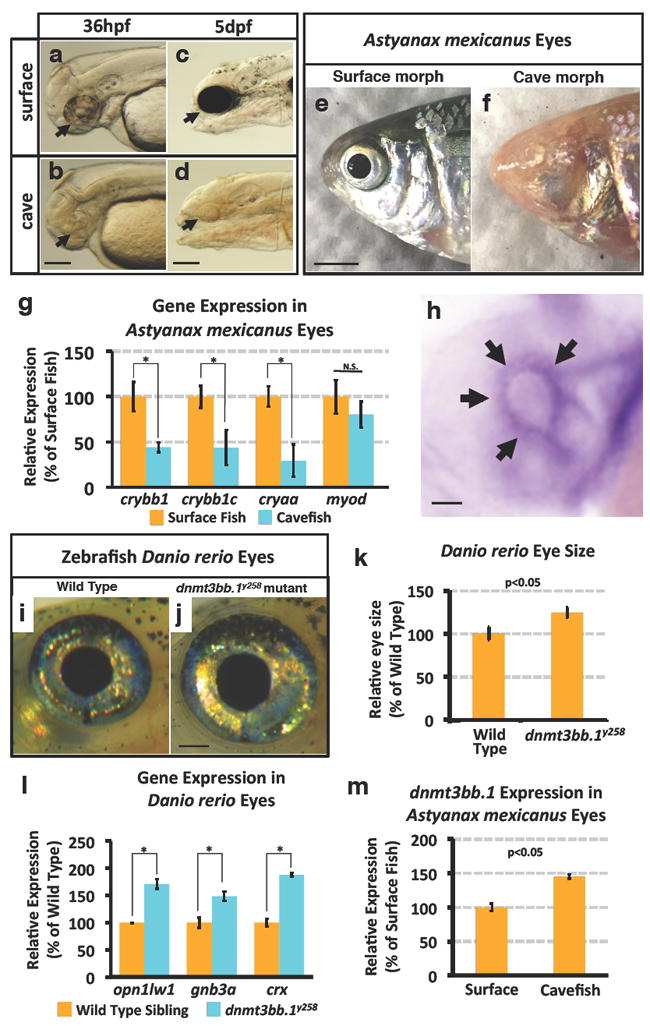
Figure 1. Eye phenotypes in Astyanax mexicanus surface and cave fish, and in zebrafish Danio rerio wild type and dnmt3bb.1y258 mutant animals.

a-d, Transmitted light photomicrographs of the heads of 36 hpf (a,b) and 5 dpf (c,d) surface (a,c) and cavefish (b,d) morphs of A. mexicanus. Black arrow mark the developing eyes in CF and SF. e,f, Photographic images of the heads of adult surface (e, with eyes) and cave (f, eyeless) morphs of A. mexicanus. g, Quantitative RT-PCR analysis of the percent relative expression of crybb1, crybb1c, cryaa, and myod in isolated heads from 54 hpf surface (orange columns) and cave (blue columns) morphs of A. mexicanus, normalized to surface fish levels. Histograms show mean, error bars represent s.e.m of three biological replicates; two-tailed t-test, *p<0.005. h, Whole mount in situ hybridization of a 36 hpf zebrafish eye probed for dnmt3bb.1, showing expression in the ciliary marginal zone (CMZ, arrows). i,j, Photographic images of the eyes of adult wild type sibling (i) and dnmt3bb.1y258 mutant (j) zebrafish. k, Quantitation of eye size in three week old wild type sibling and dnmt3bb.1y258 mutant animals. Histograms show mean, error bars represent s.d. in the relative eye size (n =18) two-tailed t-test, *p<0.05. l, Quantitative RT-PCR analysis of the percent relative expression of opn1lw1, gnb3a, and crx in adult wild type sibling (orange columns) and dnmt3bb.1y258 mutant (blue columns) zebrafish eyes, normalized to wild type sibling levels. Histograms show mean, error bars represent s.e.m of three biological replicates; two-tailed t-test, *p<0.005. m, Quantitative RT-PCR analysis of the percent relative expression of dnmt3bb.1 in surface and cave morphs of A. mexicanus, normalized to surface fish levels. All images are lateral views, rostral to the left. Histograms show mean, error bars represent s.e.m of three biological replicates, p<0.05 using t-test. Scale bars 100μM in b for a,b, 250μM in d for c,d, 3mm in e for e,h, 50μM for h and 1mm in j for i,j.
