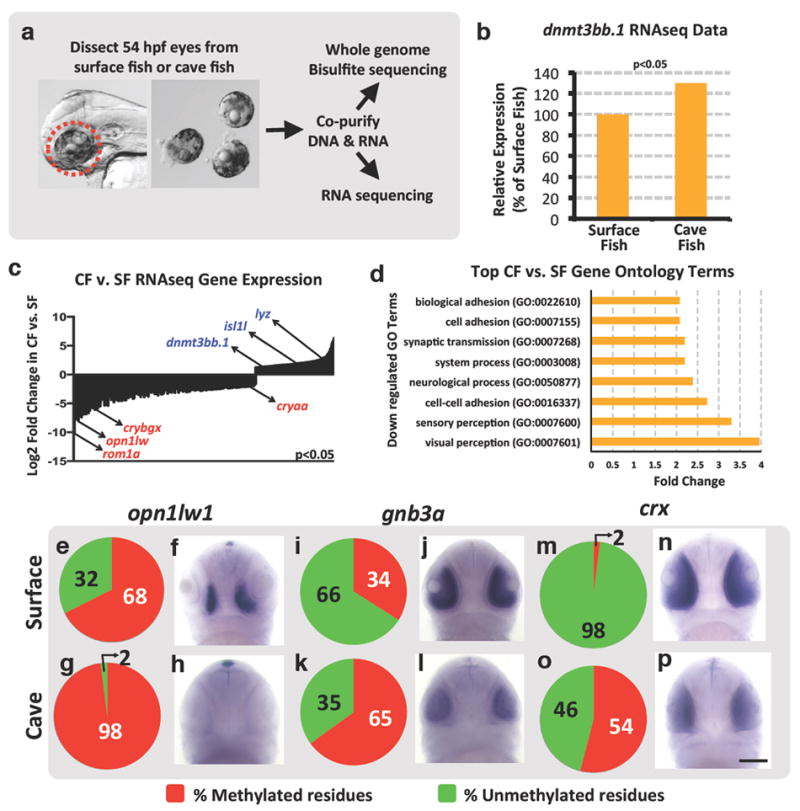
Figure 2. Gene expression changes in cave versus surface fish morphs of Astyanax mexicanus.

a, Diagram showing the workflow for obtaining larval eyes from A. mexicanus and for co-isolating eye DNA and RNA for whole genome assessment of DNA methylation and gene expression, respectively. b, Percent relative expression of dnmt3bb.1 in the eyes of A. mexicanus cave vs. surface fish morphs by comparison of their respective RNAseq data sets (2-replicates), normalized to surface fish levels, FPKM p<0.05. c, Log2 fold differential expression (p<0.05) of genes in A. mexicanus cave vs. surface fish morph RNAseq data sets, with down-regulated (red) or up-regulated (blue) expression of selected genes in CF noted. d, Listing of the Gene Ontology (GO) terms showing the greatest down-regulation in cave fish compared to surface fish. e-p, Assessment of opn1lw1(e-h), gnb3a (i-l), and crx (m-p) promoter DNA methylation (e,g,i,k,m,o) and gene expression (f,h,j,l,n,p) in 54 hpf surface (e,f,i,j,m,n) or cave (g,h,k,l,o,p) morphs of A. mexicanus. Panels show pie chart graphical representation of the percentage methylation of the promoter CpG (e,g,i,k,m,o), and representative whole mount in situ hybridization of the larval heads (f,h,j,l,n,p) using the probes noted (ventral views, rostral up, minimum 20-25 embryos were analyzed by in situ hybridization). Scale bar 100μM in p for f,h,j,l,n, and p.
