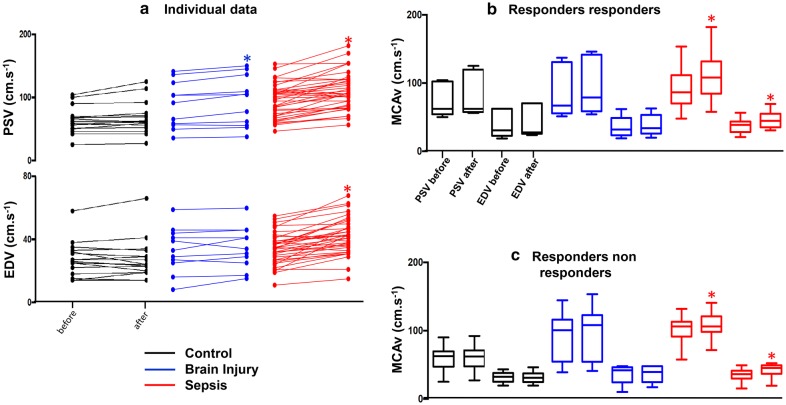
Fig. 2.
a (Left side) The individual data for middle cerebral velocities before and after fluid challenge in the three studied groups: control (black color), brain injury (blue color) and septic patients (red color). The right side of the figure shows the box plot for the middle cerebral artery velocities (MCAv) at peak systole (PSV) and end diastole (EDV); b patients responding both in mean blood pressure and CO; c patients responding only in CO and not in mean blood pressure. *p value < 0.05

