
Figure 2. Effects of Parkin knockout on muscle contractility and phenotype.
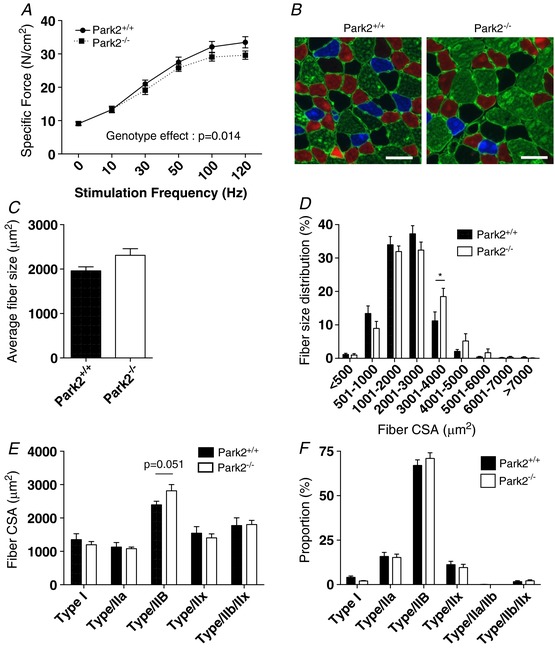
A, in situ specific force of the TA muscle of Park2−/− and Park2+/+ expressed as a function of the stimulation frequency (n = 5 or 6). B, representative immunolabeling for type I (blue), type IIa (red) and type IIb (green) MHC of a gastrocnemius cross‐section of Park2−/− (right) and Park2+/+ (left) mice. Type IIx fibre, unstained on these images, shown in black. Laminin was also immunolabelled to highlight fibre borders (green line surrounding each muscle fibre). C, quantification of the overall fibre size of the gastrocnemius muscle of Park2−/− and Park2+/+ mice (n = 6 or 7). D, quantification of the fibre size distribution of the gastrocnemius muscle of Park2−/− and Park2+/+ mice (n = 6 or 7). E, quantification of the average fibre size for each fibre type of the gastrocnemius muscle of Park2−/− and Park2+/+ mice (n = 6 or 7). F, quantification of the fibre type proportion the gastrocnemius muscle of Park2−/− and Park2+/+ mice (n = 6 or 7). Statistical analyses for data shown in (A), (D), (E) and (F) were performed using a two‐way ANOVA. Corrections for multiple comparisons were performed by controlling for the false discovery rate using the two‐stage method of Benjamini and Krieger and Yekutieli (with q < 0.1). * P < 0.05 and q < 0.1.