
Figure 8. Effects of Parkin knockout on markers of autophagy.
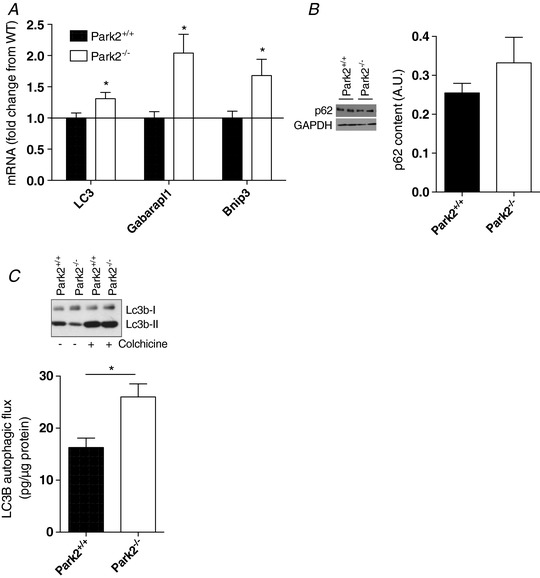
A, quantification of the mRNA expression of LC3, Gabarapl1 and Bnip3 performed using muscle homogenates from Park2−/− and Park2+/+ mice by western blotting (n = 6). B, quantification of the p62 content in skeletal muscle of Park2−/− and Park2+/+ mice by western blotting (n = 4 per group). C, quantification of the autophagic flux in skeletal muscle of Park2−/− and Park2+/+ mice (n = 6).