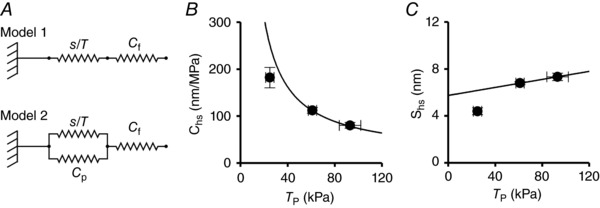
Figure 3. Mechanical models of the hs (A) and dependence of the hs compliance C hs (B) and hs strain s hs (C) on force.

A, two component model (Model 1) and two component model with an elastic element in parallel with myosin motors (Model 2). Parameters defined in the text. B and C, dependence of Chs (B) and shs (C) on T p modulated by [Ca2+]o. The line in (C) is calculated by fitting a first‐order regression to the two data points at T p > 40 kPa with fixed slope given by C f (17.1 nm MPa–1; see Appendix). The ordinate intercept (5.74 ± 0.02 nm) is the only free parameter and estimates the average strain of the attached myosin motors (s 0) at the peak of the twitch. The line in (B) is C hs at any force calculated from the straight line in (C). Data are the mean ± SEM from nine trabeculae.
