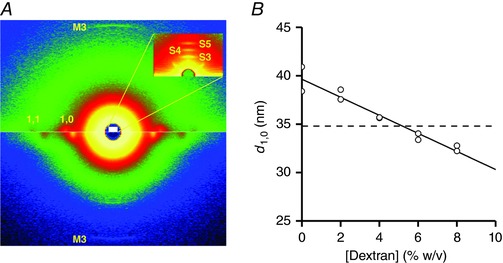
Figure 4. Effect of the increase of dextran concentration on the lattice spacing of skinned trabeculae.

A, 2‐D diffraction patterns from a skinned trabecula in a solution without dextran (lower half) and with 8% dextran (upper half) collected with a sample to detector distance of 3 m and a 40 ms exposure time each. The equatorial 1,0 and 1,1 and meridional M3 reflections are indicated. The white area corresponds, in the reciprocal space, to the inset that shows a detail of a pattern collected with 31 m sample‐to‐detector distance (2 ms exposure time). The third‐ to fifth‐order sarcomeric reflections are indicated: their positions in the reciprocal space correspond to a sarcomere length of 2.2 μm. B, lattice spacing estimated as the distance between the lattice planes made by the myosin filaments (d 1,0). The line is the linear regression fit to the data (pooled from two trabeculae). The slope of the line is –0.93 ± 0.09 nm per 1% change in dextran concentration. Dashed line, d 1,0 value from intact rat trabeculae at sarcomere length 2.2 μm.
