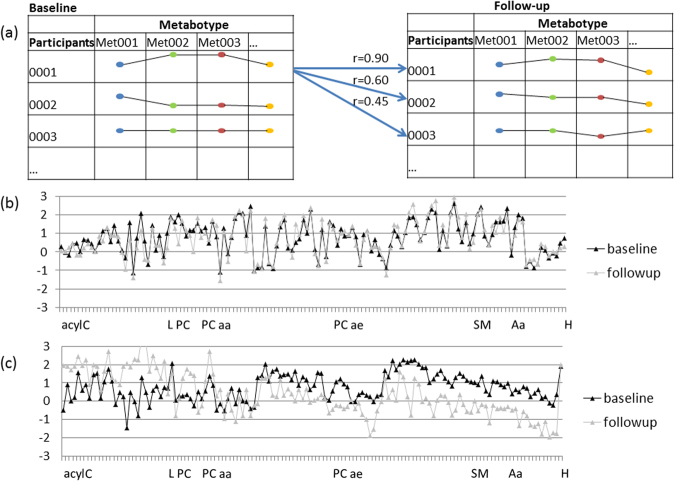
Figure 2.
(a) Description of the calculation of the conservation index (long-term stability of individual profiles). The correlations of each baseline metabotype with all other metabotypes at follow-up, are converted to ranks to measure a metabotype’s similarity to itself when compared to its similarity to other metabotypes. The conservation index is calculated as 1 − ((rank(i) − 1)/(N − 1)), where N is the number of metabotypes and (i) is each participants. This index quantifies the comparison of intra-correlations to inter-correlations, yielding a value in the range [0,1]. Log- and standardised metabolite concentrations for baseline (black lines) and follow-up (grey dotted lines) of a participant with high conservation index = 1 (b) and another with low conservation index = 0.62 (c).

