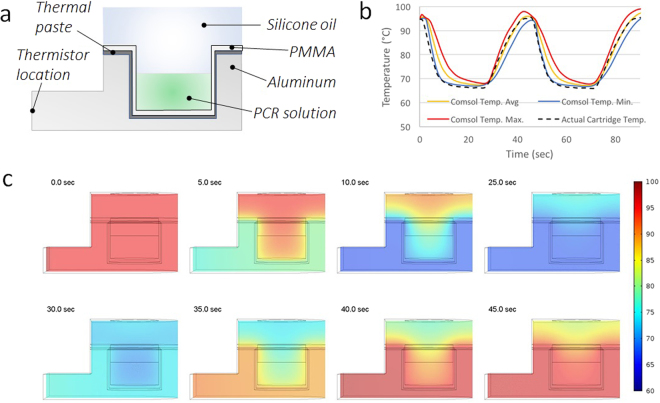
Figure 4.
PCR Thermal Cycling Characterization. (a) Cross-sectional schematic of the aluminum heat block with inserted PCR well of thermoformed cartridge. Thermally conductive paste was used to ensure complete contact and heat transfer between the heat block and cartridge. (b) Comparison of maximum, average, and minimum temperature of the PCR solution tracked during finite-element COMSOL simulation versus actual temperature measured by a separate thermistor directly within the cartridge well during thermal cycling. (c) Temperature heat-map snapshots from cross-section of the finite-element simulation. The top row follows cooling from a uniform temperature of 95 °C while the bottom row shows the heating back to 95 °C. Uniform temperature distribution within ~1 °C of the target annealing and denaturation temperatures is evident throughout the entire PCR solution delineated by the rectangle at the bottom of the well at the end of each heating and cooling phase.

