Figure 5.
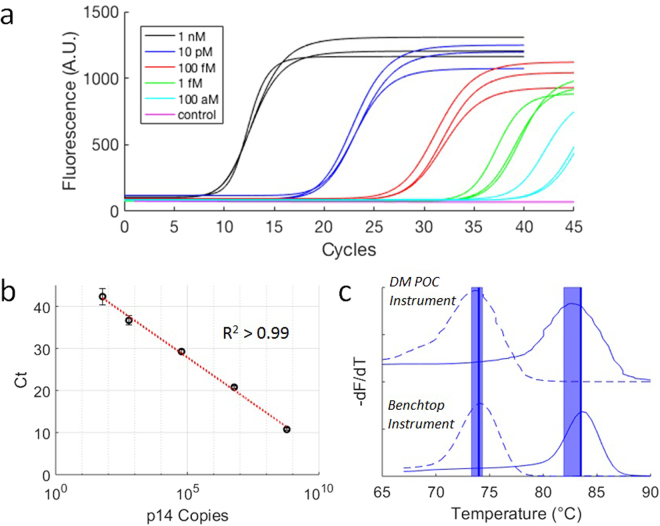
Cartridge PCR and melt performance. (a) Real-time fluorescence of PCR thermal cycling on cartridge using 10 µl PCR solutions directly spiked with dilutions of synthetic p14(ARF) oligonucleotide targets ranging from 1 nM to 100 aM in concentration (n = 3 for each dilution). No specific amplification was detected with a negative control (pink). (b) Standard curve generated from the cycle threshold (Ct) values calculated from the PCR in (a). (c) Comparison of p14(ARF) amplicon melt curves generated by our instrument (top) with those generated by a commercial benchtop thermocycler (bottom). The dashed lines indicate the low melt temperature curve of a shorter nonspecific product that is amplified when a PCR solution is left at room temperature for several hours, while the solid lines are melt curves of the desired amplicon products produced when the target is present in the PCR solution. The dark vertical lines represent the benchtop thermal cycler melt temperatures (Tm = 74 °C and 83.5 °C) which had a 0.5 °C resolution and were consistent between runs. The broader vertical bars denote one standard deviation from the average melt temperatures detected with the cartridges (Tm = 73.8 ± 0.5 °C and 82.7 ± 0.8 °C).

