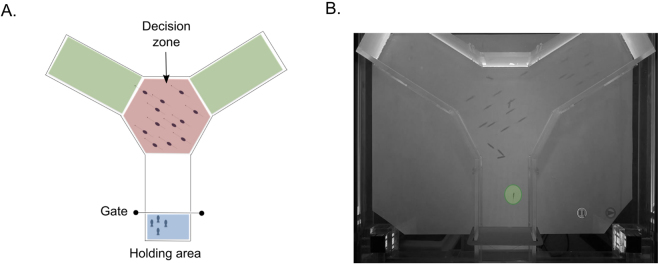
Figure 1.
Experimental domain. Panel (A) illustrates the relative locations of the holding area (blue), decision zone in which the virtual fish silhouettes were projected (red), and the destination arms (green). Panel (B) shows a grayscale image of the domain in which a zebrafish (orange circle) makes its way up from the holding area towards the decision zone where the virtual silhouettes are projected. The virtual shoal’s coherency here is C = 0.67, with leader silhouettes moving towards the right arm.

