
Figure 4.
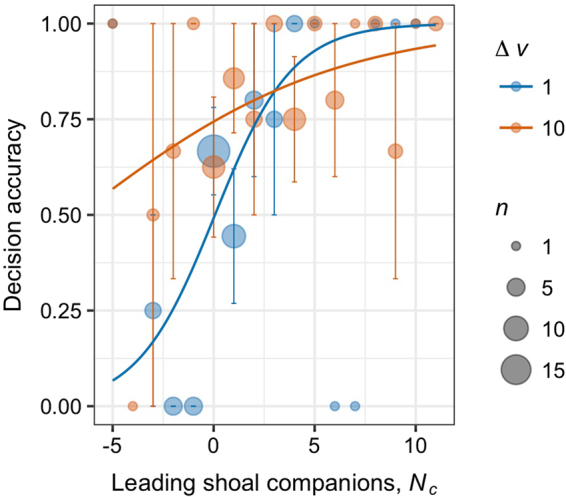
The effects of leading companions and the relative speed of the visual stimuli on decision accuracy. The proportion of accurate decisions are plotted as a function of the number of neighbors ahead of the subject who have already made a correct decision minus those who choose incorrectly, Nc. Data are also grouped by the relative speed of the visual stimuli (Δv; color). Data points are means ± SE and solid lines show the best fit of the logistic model within Δv treatments (model parameters: Δv = 1, a = 0.52, b = 0.07; Δv = 10, a = 0.16, b = −6.73). Circle sizes reflect the number of observations for each Nc value and denoted by n.