Fig. 5.
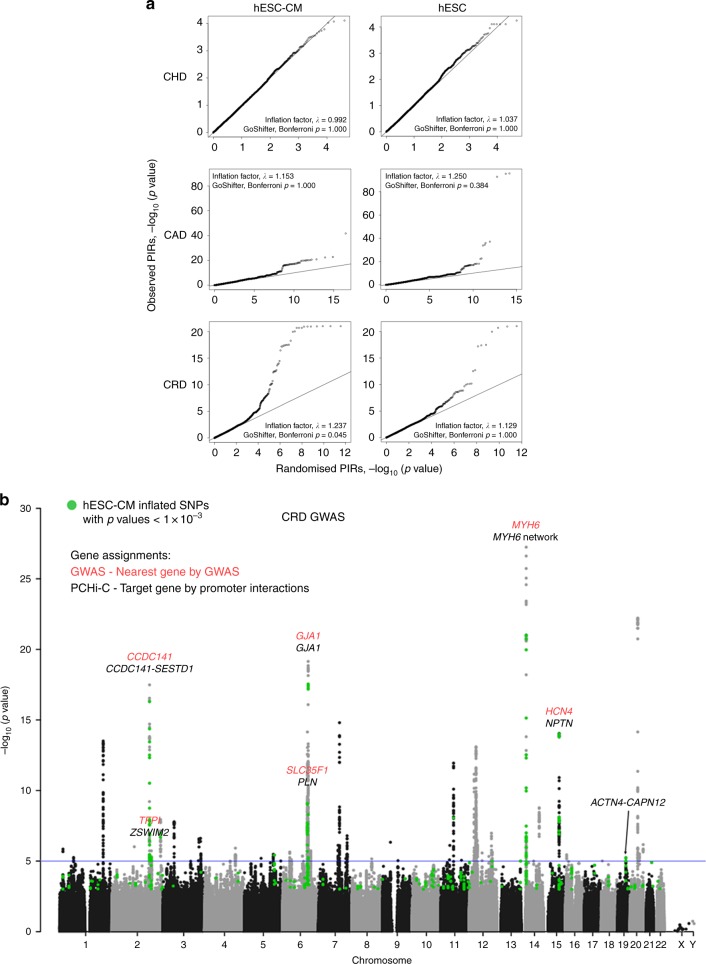
Association of hESC-CM promoter interactions with cardiac conduction and rhythm disorders. a QQ plots of –log10(p values) corresponding to SNPs located in the top 20% cPIR or hESC PIRs of three GWAS studies, congenital heart disease25, 26 (CHD; total SNPs = 500K; hESC-CM SNPs = 19K; hESC SNPs = 19K), coronary artery disease26 (CAD; total SNPs = 9.5 M; hESC-CM SNPs = 289K; hESC SNPs = 328K; http://www.cardiogramplusc4d.org) and cardiac conduction and rhythm disorders27 (CRD; total SNPs = 2.5 M; hESC-CM SNPs =85K; hESC SNPs = 80K), against randomised PIRs (average of 1000 permutations). Significance of overlaps between GWAS SNPs (p < 0.001) and the top 20% cPIRs or hESC PIRs were tested using GoShifter28. b Manhattan plot of CRD GWAS27. Green spots indicate inflated SNPs in the cPIR/randomised PIR QQ plot with p < 0.001. Red gene names are nearest genes to the SNPs in the significant peaks assigned by the GWAS and black gene names are target genes interacting with the cPIRs containing the significant SNPs (p < 1 × 10⁻⁵)

