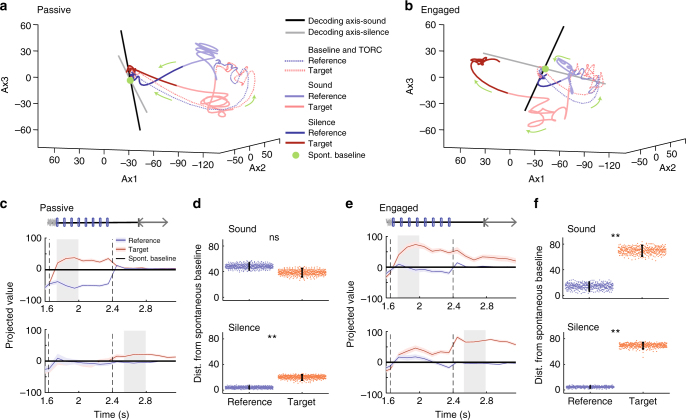
Fig. 3.
Task engagement induces shift from symmetric to asymmetric representation of target and reference stimuli. a Population response during target and reference stimuli in the passive state along the first three components identified using GPFA (see Methods) on single trial data. The session begins at the baseline (green dot), followed by the TORC presentation, (dotted line) then the click presentation of either the target and the reference sound (light red and blue, respectively) and finally the post-sound silence period (dark red and blue). Note in particular that, in the passive state, the reference and target activities move away symmetrically from the baseline point given by projection of spontaneous activity. b As in a, for the task-engaged state. Note that, in this state, target activity makes a much larger excursion from the baseline than reference activity. The axes are the same as in a, as the GPFA analysis was performed jointly on passive and engaged data. c Projection onto the decoding axis of trial-averaged reference- and target-evoked responses for the whole neural population. A baseline value computed from prestimulus spontaneous activity was subtracted for each unit, so that the origin corresponds to the projection of spontaneous activity (shown by black line). Decoding axes determined during sound presentation and post-stimulus silence are, respectively, used for projections in the top and bottom rows. The periods used to construct the decoding axis are shaded in gray. Error bars represent 1 std calculated using decoding vectors from cross-validation. This procedure allows for the visualization of the distance between reference- and target-evoked projections (that corresponds to decoding strength) and the distance of the stimuli-evoked responses from the baseline of spontaneous activity can be interpreted as the contribution of each stimulus to decoding accuracy. d Distance of reference and target projections from baseline in each condition during the sound and silence period. Error bars represent 95% confidence intervals (n = 400 cross-validations; p = 0.15 and p < 0.0025; **p< 0.01). e As in c for the engaged state. f As in d for the engaged state. (n = 400 cross-validations; p < 0.0025 and p < 0.0025; **p < 0.01)

