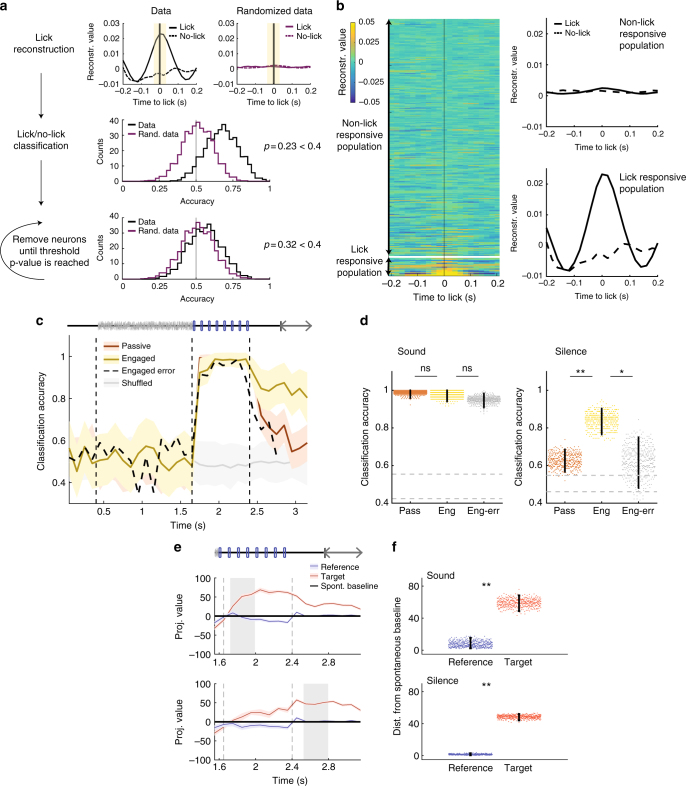
Fig. 4.
Relation between A1, motor activity, and behavioral outcome a Schematic of the approach used to identify lick-responsive units. First, we reconstructed licks using optimal filters as for click reconstruction (Fig. 1). The filter is applied during licks and also during randomly selected time points with no licks (top left). We evaluated the accuracy of classifying lick and no-lick time events using a linear decoder (black distribution, middle panel). In both cases, the significance was tested using randomized data (top right and purple distribution, middle panel). We iteratively removed the best classification units (bottom plot) until the p value was >0.4 and the two distributions were indistinguishable. b Results of reconstruction of lick events and removal of lick units. Left: heatmap of average lick reconstruction for all neurons ordered by classification weight. Right: average reconstruction of lick and no-lick events using units retained for population analysis (non-lick responsive) and units excluded from the population analysis (lick responsive). c Accuracy of stimulus classification in passive and engaged states using only non-lick-responsive units. Note that, after removal of lick-responsive units, the discrimination during post-stimulus silence is still enhanced in the task-engaged state on correct trials but is low during error trials. Error bars represent 1 std calculated over 400 cross-validations. d Comparison of mean accuracy on passive, task-engaged correct and task-engaged error trials, during sound (left) and post-stimulus silence periods (right). Error bars represent 95% confidence intervals. (n = 400 cross-validations; sound: pass/eng p = 0.22, eng/err: p = 0.87; silence: pass/eng p < 0.0025, eng/err: p = 0.012; *p < 0.05, **p < 0.01) e Projection onto the decoding axis of baseline-subtracted population vectors during the engaged condition constructed using activity of non-lick-responsive units only for the reference and target stimuli. Projections are shown onto the decoding axes obtained on early sound (top) and silence periods (bottom) (shaded epochs). The origin corresponds to the projection of spontaneous activity (shown by black line). Error bars represent 1 std (cross-validation n = 400). f Distance of reference and target projections from baseline in the engaged condition during sound and silence periods. Error bars represent 95% confidence intervals (n = 400 cross-validations; p < 0.0025 and p < 0.0025; **p < 0.01)

