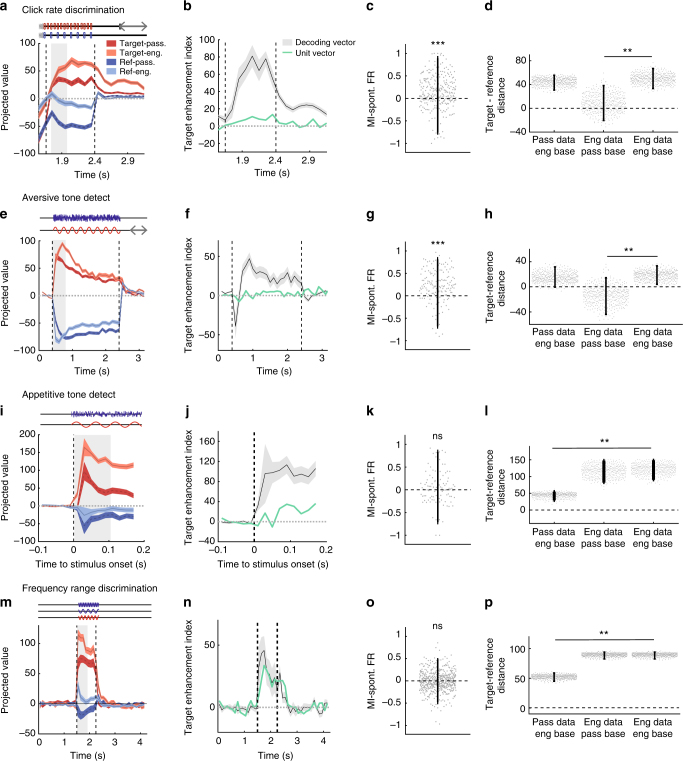
Fig. 7.
Enhanced representation of target stimuli in a range of auditory Go/No-Go tasks. Each line of four panels represent the same analysis for all four tasks; statistics are given in order of appearance in the figure. a, e, i, m Projection onto the decoding axis determined during the sound period of trial-averaged reference (blue) and target (ref) activity during the passive (dark colors) and the engaged (light colors) sessions. A baseline value computed from spontaneous activity was subtracted for each neuron, so that the origin corresponds to the projection of spontaneous activity (shown by black line). Note that the target-driven activity is further from the baseline in the engaged state and the reference-driven activity is closer. The periods used to construct the decoding axis are shaded in gray. Error bars represent 1 std (cross-validation n = 400). b, f, j, n Index of target enhancement induced by task engagement based on projections using the decoding axis determined during the sound. In green, same index computed instead by giving the same weight to all units. The difference between the green and black curved indicates that the change in asymmetry induced by task engagement cannot be detected using the population averaged firing rate alone. Error bars represent 1 std (cross-validation n = 400). c, g, k, o Modulation index of each unit for spontaneous firing rate after exclusion of lick-related units. Error bars are 95% CI (one-sample two-sided Wilcoxon signed-rank test with mean 0, n = 277, zval = 6.35, p = 2.1e-10; n = 161, zval = 7.22, p = 5.4e-13; n = 99, zval = 1.01, p = 0.30; n = 520, zval = −0.78, p = 0.47; ***p < 0.001). d, h, l, p Comparison of reference/target asymmetry for evoked responses in different states relative to different baselines given by passive or engaged spontaneous activity. Reference/target asymmetry is the difference of the distance of target and reference projected data to a given baseline. We examine three cases: (i) passive evoked responses, distances calculated relative to engaged spontaneous activity; (ii) engaged evoked responses, distances calculated relative to passive spontaneous activity; (iii) engaged evoked responses, distances calculated relative to engaged spontaneous activity. In all three cases, the engaged decoding axis was used for projections. Error bars represent 95% confidence intervals (n = 400 cross-validations; p(col1,col3) = 0.29 and p(col2,col3) < 0.0025; p(col1,col3) = 0.38 and p(col2,col3) < 0.0025; p(col1,col3) < 0.0025 and p(col2,col3) = 0.16; p(col1,col3) < 0.0025 and p(col2,col3) = 0.92; **p < 0.01)

