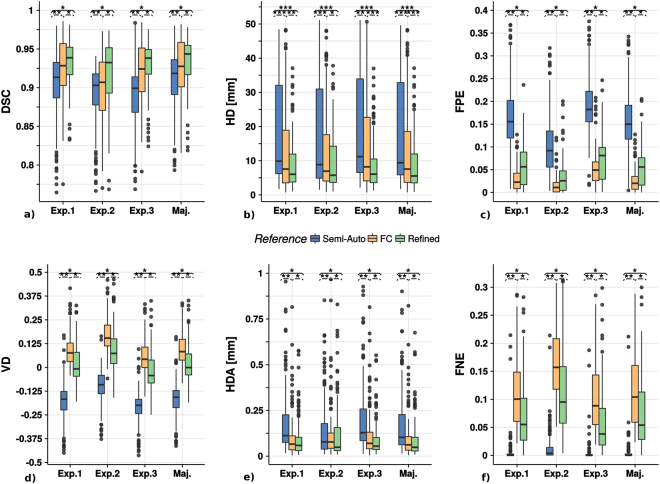
Figure 5.
Boxplot charts for the similarity indexes: (a) Dice Similarity Coefficient (DSC); (b) Hausdorff Distance (HD); (c) False Positive Error (FPE); (d) Volume Dissimilarity (VD); (e) Hausdorff Distance Averaged (HDA); (f) False Negative Error (FNE). The lung segmentation obtained with the proposed method (refined) is compared with the semi-automatic (semi-auto) and the fuzzy connectedness approaches in the individual expert annotations (Exp. 1, Exp. 2 and Exp. 3) and the surrogate ground truth obtained by the expert consensus as explained in the Supplementary Material (Maj.). The asterisks over each group of boxes indicate statistically significant differences between the lung segmentation methods compared: , and .

