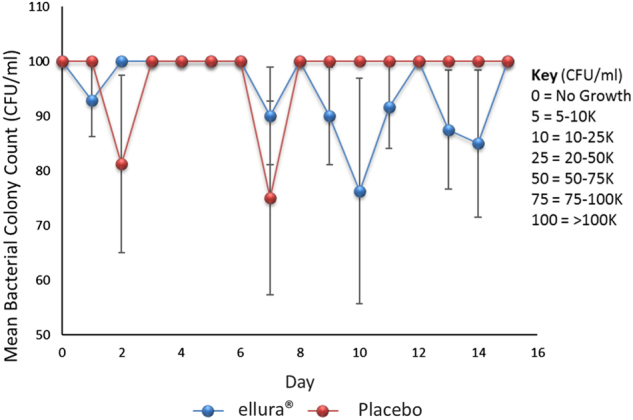
Fig. 1.

Mean bacterial colony count. Scatter plot with positive and negative error bars representing mean bacterial colony count for all patients over the 15-day trial period. Key indicates conversion of incremental lab reported values to discrete values for the purposes of statistical analysis
