
Fig. 2.
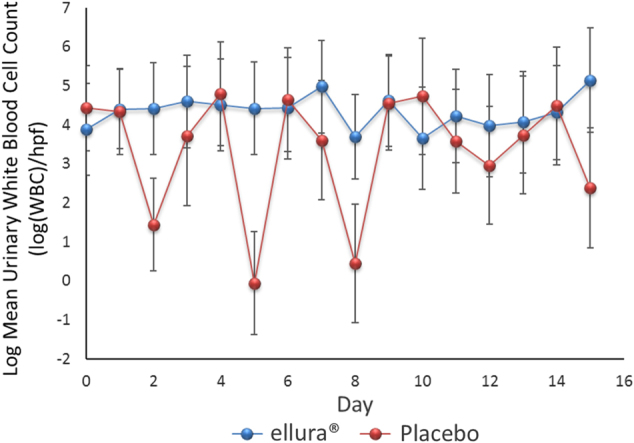
Logarithmic form of the mean urinary white blood cell count. Scatter plot with positive and negative error bars representing the mean urinary white blood cell count for all patients over the 15-day trial period. The logarithmic form of the data were used for statistical analysis because of the variability of the data