
Fig. 3.
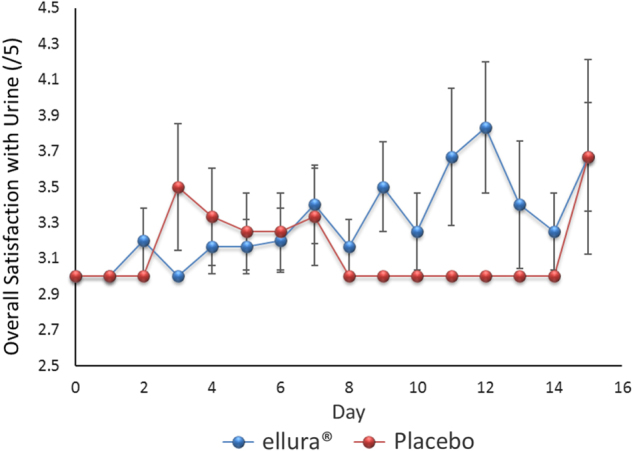
Overall satisfaction with urine quality. Scatter plot with positive and negative error bars representing the mean rating of overall satisfaction with urine quality for all patients over the 15-day trial period. Rating scale of 1–5 was used, with 1 indicating much worse and 5 indicating much improved from baseline