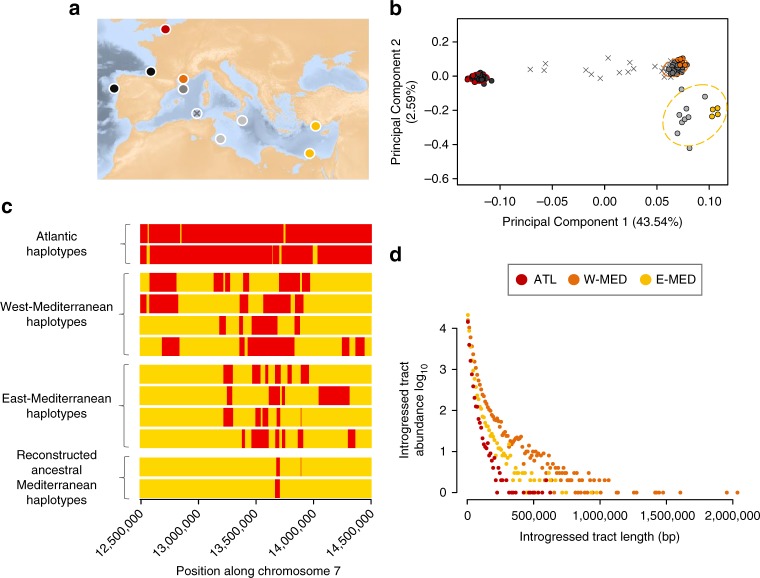
Fig. 1.
Spatial population structure and local ancestry patterns. a Geographical location of samples, including the newly sequenced genomes (colored circles) and additional reference samples from the Atlantic (dark gray), W-MED (gray), E-MED (light gray), and the Algerian admixture zone (gray crosses). b Principal Component Analysis of newly sequenced genomes combined with 112 individuals genotyped at 13,094 common SNPs (MAF > 0.1). The first PCA axis distinguishes Atlantic and Mediterranean populations while the second axis reveals a subtle population structure between W-MED and E-MED. Some individuals from the Algerian coast represent admixed genotypes between Atlantic and Mediterranean populations. c Schematic representation of a 2 Mb region within chromosome 7, showing the mosaic of ancestry blocks derived from Atlantic (red) and Mediterranean (yellow) populations. For simplification, we only display two individual haplotypes from Atlantic samples, four from W-MED, four from E-MED, and two reconstructed ancestral Mediterranean haplotypes from E-MED samples. d Migrant tract length distribution obtained for the Atlantic (red, showing tracts of Mediterranean origin), W-MED (orange), and E-MED (yellow) populations (showing tracts of Atlantic origin) using four individuals per population and a total of 2,628,725 phased SNPs

