
Fig. 2.
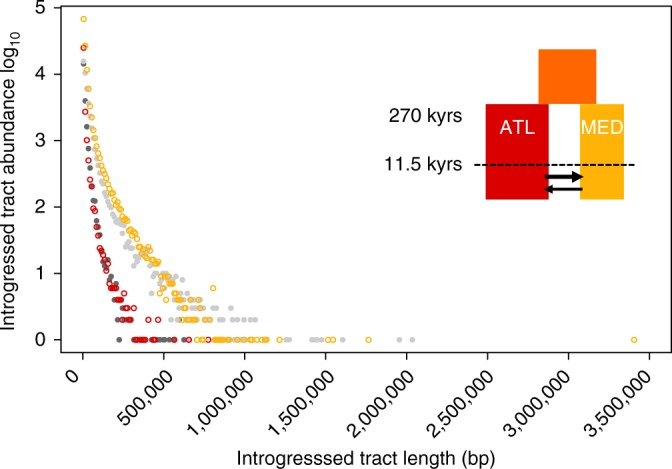
Observed and simulated migrant tract length distributions in the Atlantic and Mediterranean populations. Observed distributions (gray) of migrant tract length are compared with simulated distributions (colored) under the post-glacial secondary contact scenario illustrated in the top-right corner31. The abundance of introgressed tracts as a function of their length is represented for observed vs. simulated data in the Atlantic (dark gray vs. red circles, showing tracts of Mediterranean origin) and Mediterranean populations (light gray vs. yellow circles, showing tracts of Atlantic origin)