Fig. 3.
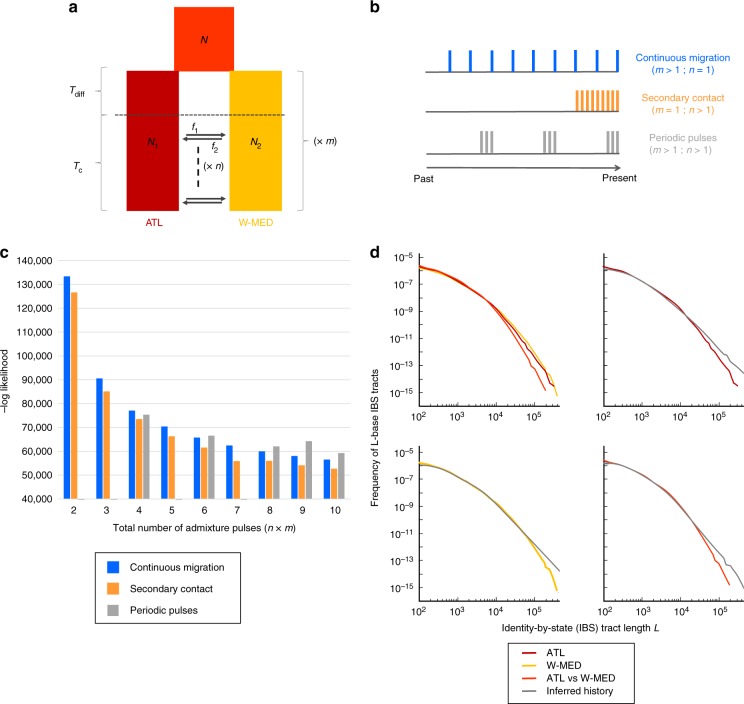
Demographic history inferred from the length distribution of IBS tracts. a Flexible demographic model accounting for multiple equal-length episodes of divergence and gene flow between Atlantic and Mediterranean sea bass populations. An ancestral population of size N splits into two populations of size N1 and N2, experiencing one to several (m) cycles of interrupted gene flow during Tdiff generations followed by migration during Tc generations. Each contact episode contains one to several (n) pulses of admixture (black arrows), replacing Mediterranean and Atlantic populations by a proportion f1 and f2 of migrants, respectively. The most recent admixture pulse occurs at time Tc/100 before the end of each contact episode, and preceding pulses are homogeneously distributed every (Tc−Tc/100)/n time interval. b Modeling scenarios fall into three different categories according to the distribution of admixture pulses over time: continuous migration, secondary contact, and periodic pulses. The illustrated example shows these three categories with nine pulses represented by vertical bars along the timeline. c The log-likelihood values obtained for each of the three modeling scenarios from two to ten admixture pulses. Two possible configurations of the periodic pulses scenario exist for models including a total of six, eight, and ten pulses (Supplementary Table 2), only the best of which is represented here. The periodic pulses scenario is not defined for two, three, five, and seven pulses. d Goodness-of-fit of the best model (m = 1, n = 10), showing the length distributions of IBS tracts from observed data (colored lines) compared to model prediction (gray lines). Upper-left: the three distributions observed within ATL and W-MED and between ATL and W-MED populations. Upper-right: model fit within ATL. Lower-left: model fit within W-MED. Lower-right: model fit between ATL and W-MED

