Fig. 1.
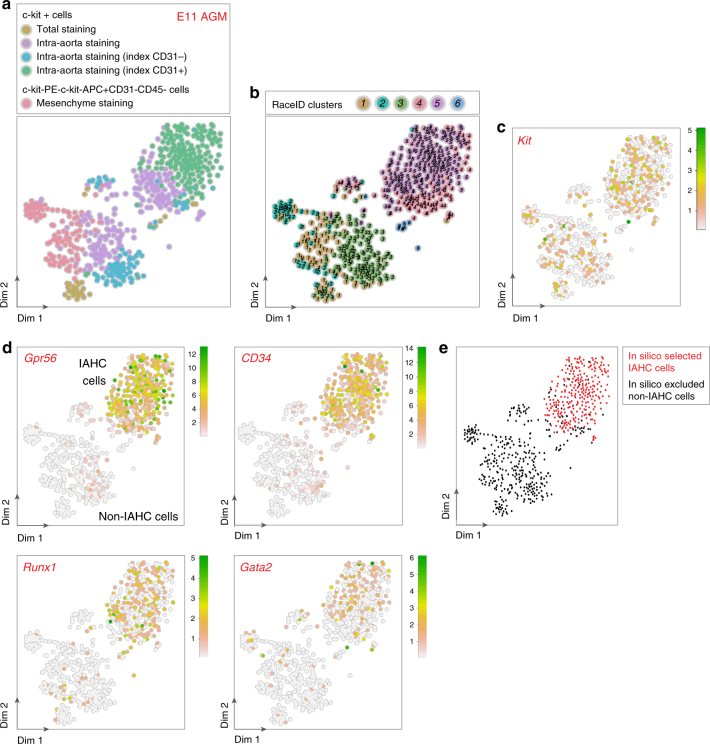
scRNA-Seq allows in silico purification of IAHC cells from E11 AGM. a–d t-SNE maps displaying as colored dots 542 single cells isolated from the aorta–gonad–mesonephros (AGMs) region of E11 embryos. a t-SNE map displaying 37 c-kit+ cells sorted after total staining (brown dots), 215 c-kit+ cells sorted after intra-aorta staining (purple dots), c-kit+ cells sorted with CD31 fluorescence intensity index after intra-aorta staining (92 c-kit+CD31− cells, blue dots; 198 c-kit+CD31+ cells, green dots), and 114 c-kit−PE−c-kit−APC+CD31−CD45− cells (pink dots). b t-SNE map displaying single cells from a in clusters identified after RaceID analysis. Different numbers and colors highlight the different RaceID clusters. c, d Expression of (c) Kit and (d) Gpr56, CD34, Runx1, and Gata2 marker genes projected on t-SNE maps. Color bars, number of transcripts. Dim dimension. e t-SNE map displaying in silico selected IAHC cells (in red) and excluded non-IAHC cells (in black)

