Fig. 2.
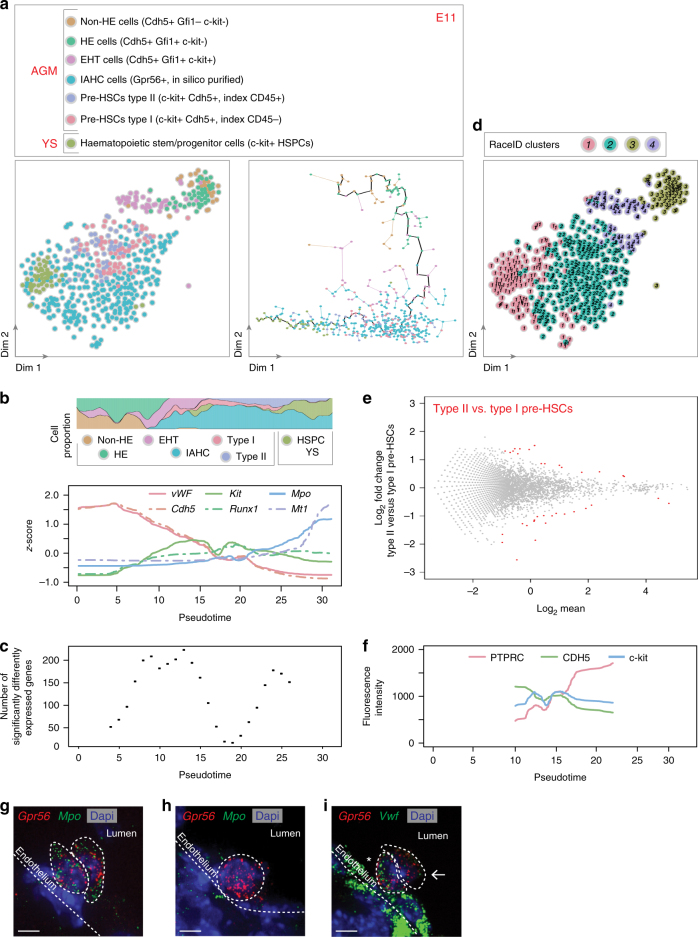
Pre-HSCs and progenitors are discernible by opposing gradients of endothelial and haematopoietic transcripts in E11 IAHCs. a t-SNE map of 554 single cells isolated from E11 embryo AGM and yolk sac (YS). a (left panel) t-SNE map displaying 27 sorted non-haemogenic endothelial cells (non-HE cells, Cdh5+Gfi1−c-kit-, brown dots), 45 haemogenic endothelial cells (HE cells, Cdh5+Gfi1+c-kit−, green dots), 43 cells undergoing endothelial-to-haematopoietic transition (EHT cells, Cdh5+Gfi1+c-kit+, purple dots), 282 IAHC cells (turquoise dots; c-kit+ cells in silico purified based on Gpr56 expression from Fig. 1a), and HSC precursors (58 pre-HSCs type I [c-kit+Cdh5+, index CD45−, pink dots] and 55 type II [c-kit+Cdh5+, index CD45+, violet dots]) from AGMs. 44 c-kit+ cells were also sorted from YS (haematopoietic stem and progenitor cells, HSPCs, khaki dots). a (right panel) Pseudotime analysis by Monocle algorithm of the cells shown in a (left panel) (same color code). b Top panel, proportion of each cell type shown in a along pseudotime; Bottom panel, endothelial and haematopoietic marker gene expression along pseudotime (vWF [von Willebrand factor], Cdh5 [VE-cadherin], Kit, Runx1, Mpo [Myeloperoxydase], Mt1 [Metallothionein 1]). c Number of significantly differentially expressed genes along pseudotime. d t-SNE plot displaying the single cells shown in a in clusters identified by RaceID analysis. e DE-Seq analysis showing the differential gene expression between type I and type II pre-HSCs (36 genes were significantly differentially expressed, red dots). f Fluorescence intensity of markers used to sort pre-HSCs along pseudotime (PTPRC [CD45], CDH5, c-kit). g–i E11 embryo cryosections hybridized with smFISH probes against Gpr56 (red dots) (g–i) and Mpo (green dots) (g, h) or Vwf (green dots) (i). IAHC cells (Gpr56+) expressing high (asterisk) or low/no levels (arrow) of Vwf in (i). Dash lines delimitate the position of the aortic endothelium and IAHC cells. Dapi marks the nuclei (blue)

