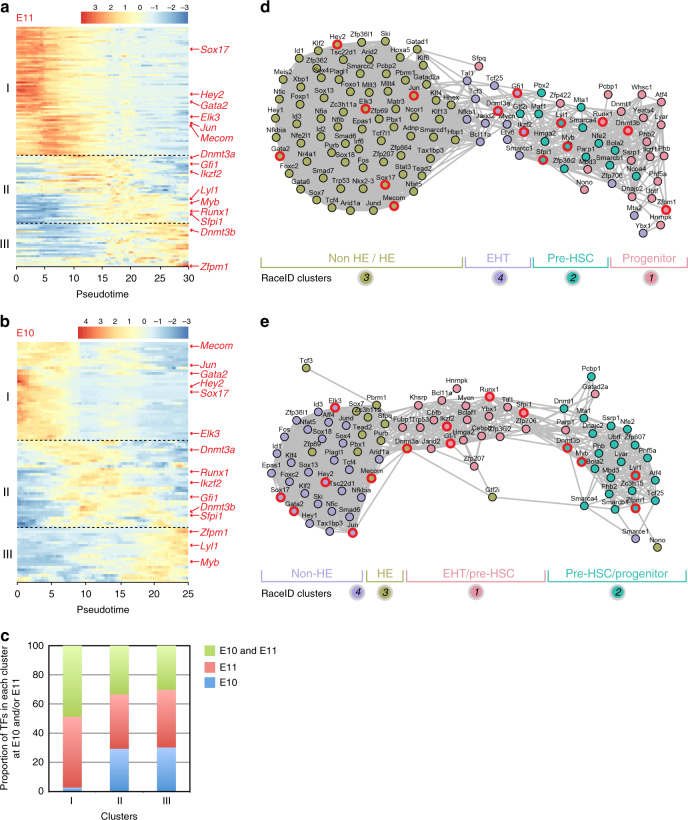
Fig. 4.
Transcription factor networks involved during IAHC formation at E11 and E10. a, b Heatmap of differentially expressed transcription factors (TFs) at a E11 and b E10 between the different cell types (non-HE, HE, EHT, IAHC cells, and YS HSPCs), according to pseudotime. Three distinct expression patterns are identified as clusters I, II, and III. c Proportion of transcription factors that are present in clusters I, II, or III at both E10 and E11, only at E11 or only at E10. d, e Network of TFs related to different expression patterns as determined in a and b, respectively. Color-coded circles are related to RaceID analysis shown in Figs. 2d and 3c, respectively. TFs mentioned in the results section are outlined in red

