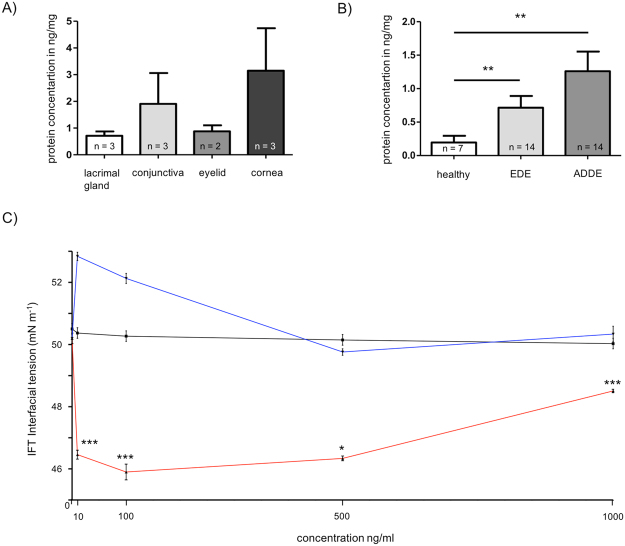
Figure 2.
Protein quantification of SFTA3 in tissues of the ocular surface as well as tear film and interfacial tension analysis. (A) Quantification of SFTA3 in ocular tissue samples. Mean values of lacrimal gland: 0.712 ng/mg, conjunctiva: 1.908 ng/mg, eyelid: 0.875 ng/mg and in cornea 3.14 ng/mg. (B) Quantification of SFTA3 in tear film. Mean values of healthy subjects: 0.196 ng/mg, EDE: 0.669 ng/mg and in ADDE: 1.157 ng/mg. The protein concentration is expressed in ng/mg and as mean ± SEM. Statistical significance: *P ≤ 0.05, **P ≤ 0.005, ***P ≤ 0.0005. (C) Interfacial tension (IFT) for different rhu-SFTA3 concentrations in tear film samples (red). As control we used water (black) and BSA (blue) as protein loading control. The IFT is expressed in mN/m−1 and as mean ± SEM. Statistical significance: *P ≤ 0.05, **P ≤ 0.005, ***P ≤ 0.0005.

