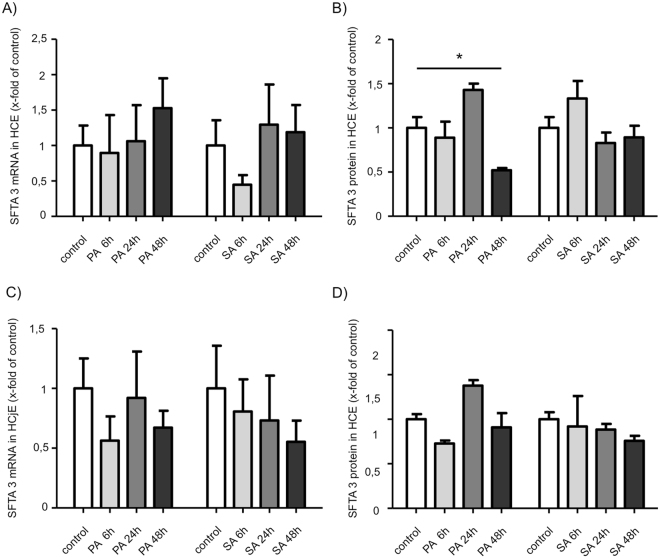
Figure 4.
SFTA3 expression after stimulation with bacterial supernatant. Stimulation of HCE cells (A,B) for 6; 24 and 48 hours with a 1:100 dilution of bacterial supernatant of Pseudomonas aeruginosa (PA) and Staphylococcus aureus (SA). (A) Relative quantification of SFTA3 mRNA by Real Time PCR. No statistical significance of the differences after 6; 24 and 48 hours (n = 3). (B) Relative quantification of SFTA3 protein by ELISA shows a statistically significant decrease after 48 hours for PA (n = 3; *P ≤ 0.05). No statistical significance after 6; 24 and 48 hours (n = 3) for SA. (C) Relative quantification of SFTA3 mRNA by Real Time PCR shows no statistical significance after 6; 24 and 48 hours (n = 3) for SA and PA. (D) Relative quantification of SFTA3 protein by ELISA shows no statistical significance after 6; 24 and 48 hours (n = 3) for SA and PA.

