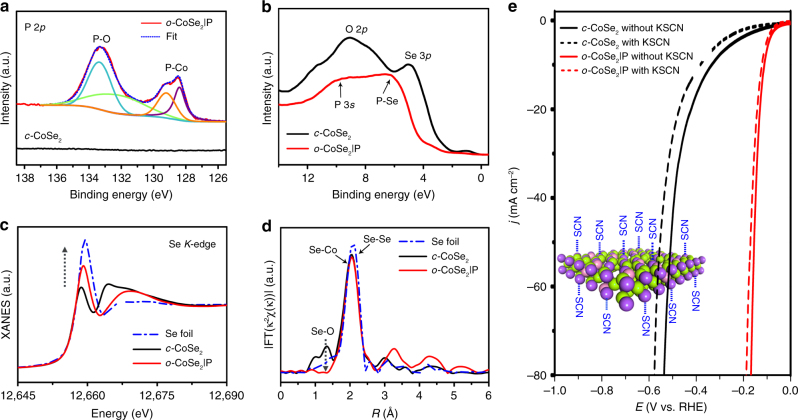
Fig. 4.
Comparison of surface structure of CoSe2 before and after P-doping. a, b P 2p XPS spectra and valence band edge XPS spectra of c-CoSe2 and o-CoSe2|P catalysts, respectively. c, d Se K-edge X-ray absorption near-edge spectra and corresponding k2-weighted Fourier transforms spectra for c-CoSe2, Se foil, and o-CoSe2|P catalysts. e Comparison of SCN− ions effects on the HER activities of c-CoSe2 and o-CoSe2|P, respectively. Inset shows the schematic of Co centers blocked by the SCN− ions

