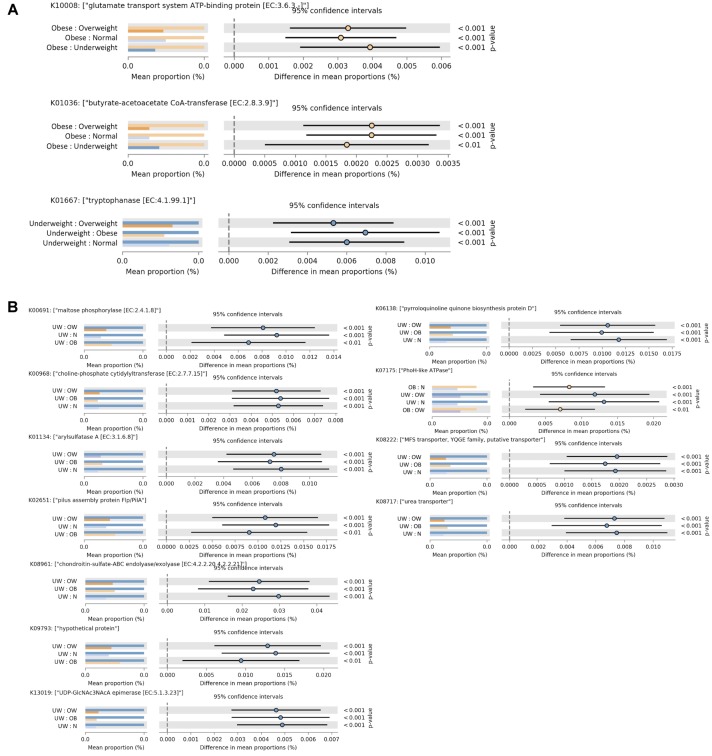
FIGURE 3.
Functional divergence of gut microbiota across different BMI groups. Significant differences in functional orthologs were identified among the four BMI groups in (A) the overall cohort and (B) males. ANOVA was applied with a post hoc test (Tukey–Kramer at 0.95), and a multiple-test correction of Benjamini–Hochberg FDR (corrected p-value (<0.005). Each bar plot indicates the mean proportion of sequences assigned to a feature in each group. Extended error bars indicate the difference in mean proportion between the two groups along with the associated confidence interval of this effect size and the p-value of the specified statistical test. UW, underweight; N, normal; OW, overweight; OB, obese.

