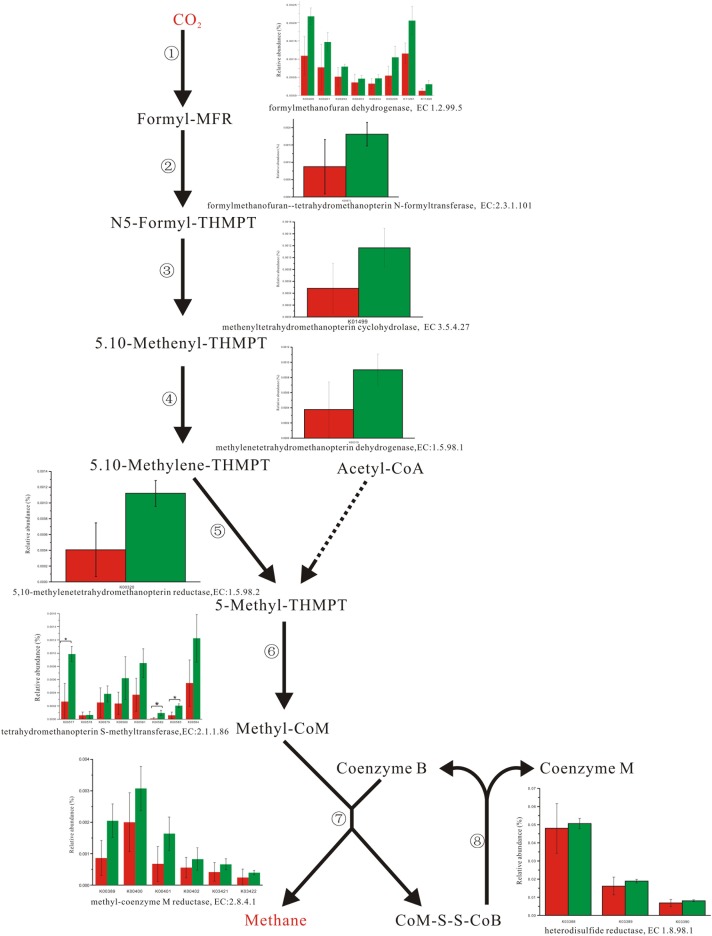
FIGURE 2.
Comparison of abundance for gene function involved in methane metabolism. Red and Green represent the Duroc group (DR) and the Lantang group (LT), respectively. Asterisk (∗) denotes P < 0.05. The dashed line represents Minor metabolic pathway in methane metabolism from KEGG reference pathway.

