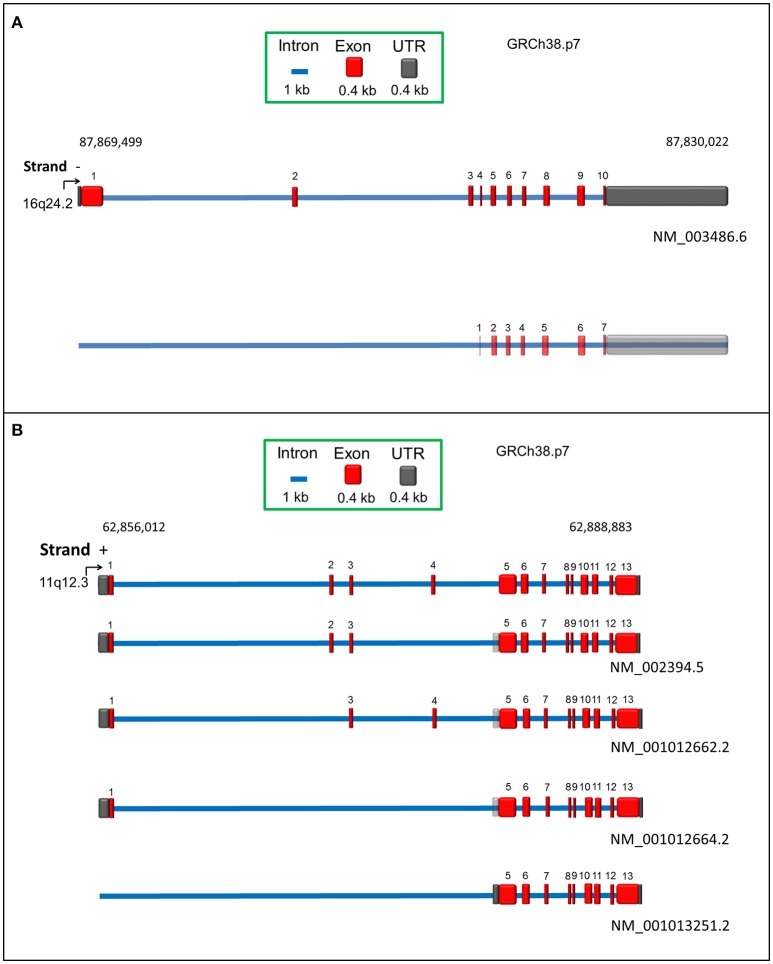
Figure 1.
Schematic representation of human SLC7A5 (A) and SLC3A2 (B) genes according to RCh38.p7 genome assembly. Intronic and exonic sequences are depicted in blue and red, respectively. UTR sequence is indicated in dark gray. Predicted UTR sequences or isoforms are in transparency. For each transcript, the relative Genbank accession number is indicated.

