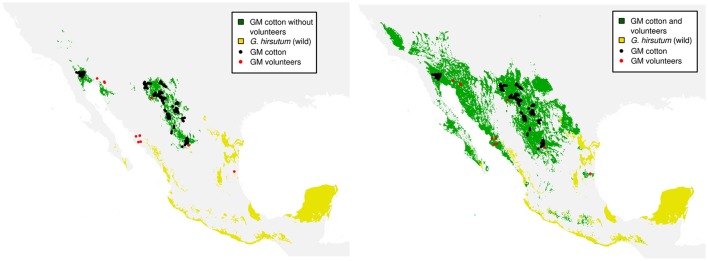
Figure 4.
GM cotton distribution models adding the presence of volunteers. In green: potential distribution of GM cotton. In yellow: potential distribution of wild cotton. Black dots indicate the records of GM cotton plots while red dots indicate the records of volunteer plants used for the elaboration of the models.

