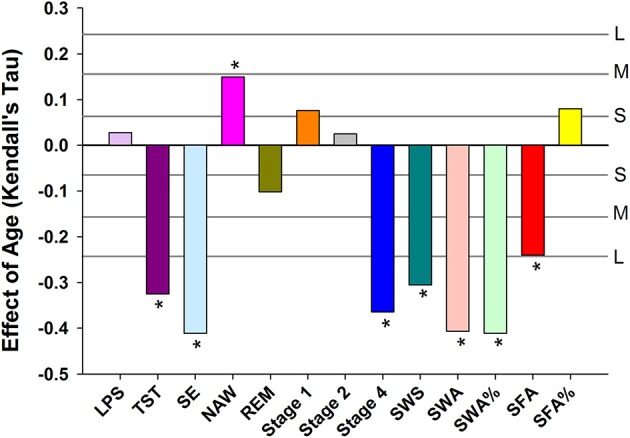
Figure 1.

Age related changes in sleep EEG parameters when controlling for sex. For reference, the horizontal lines indicate the corresponding Cohen's d effect size: S, small, d = 0.2; M, medium, d = 0.5; H, high, d = 0.8. * indicate significant effects following FDR (False-Discovery Rate) correction (p < 0.05). LPS, latency to persistent sleep (min); TST, total sleep time (min); SE, sleep efficiency (%); NAW, number of awakenings; REM, rapid eye movement; Stage 1, duration of stage 1 sleep (min); Stage 2, duration of stage 2 sleep (min); Stage 4, duration of stage 4 sleep (min); SWS, slow wave sleep; SWA, slow wave activity (μV2); SWA%, slow wave activity in percentage of total power; SFA, sigma activity (μV2); SFA%, sigma activity in percentage of total power.
