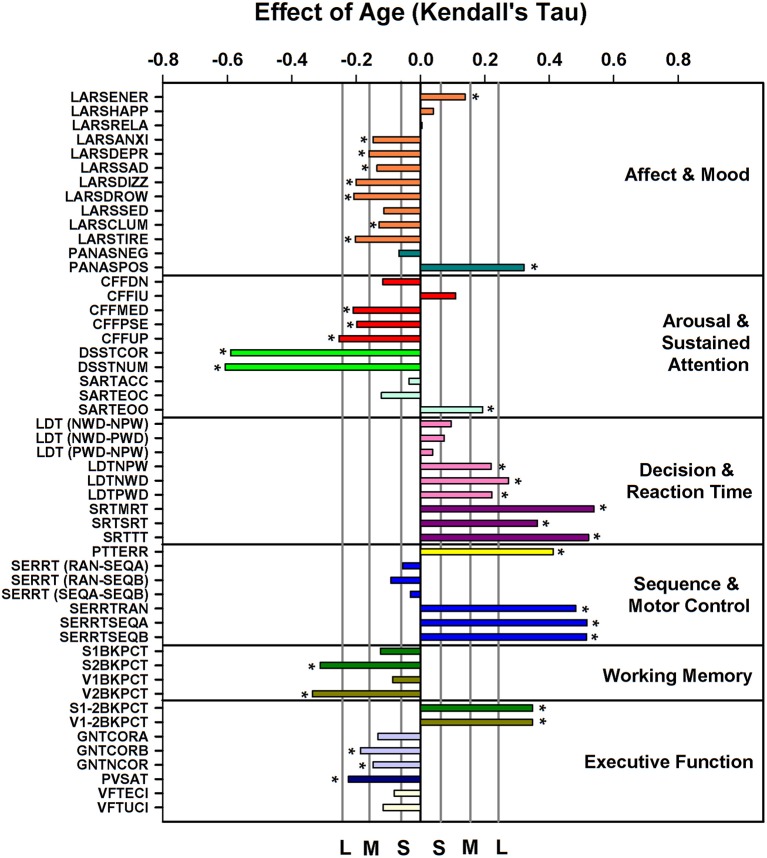
Figure 3.
Effect of age on cognition/performance variables, plotted according to cognitive domain, when controlling for sex. For reference, vertical lines indicate the corresponding Cohen's d effect size: S, small, d = 0.2; M, medium, d = 0.5; H, high, d = 0.8. * indicate significant effects following FDR (False-Discovery Rate) correction (p < 0.05). Performance variables are described in Supplemental Table 6.

