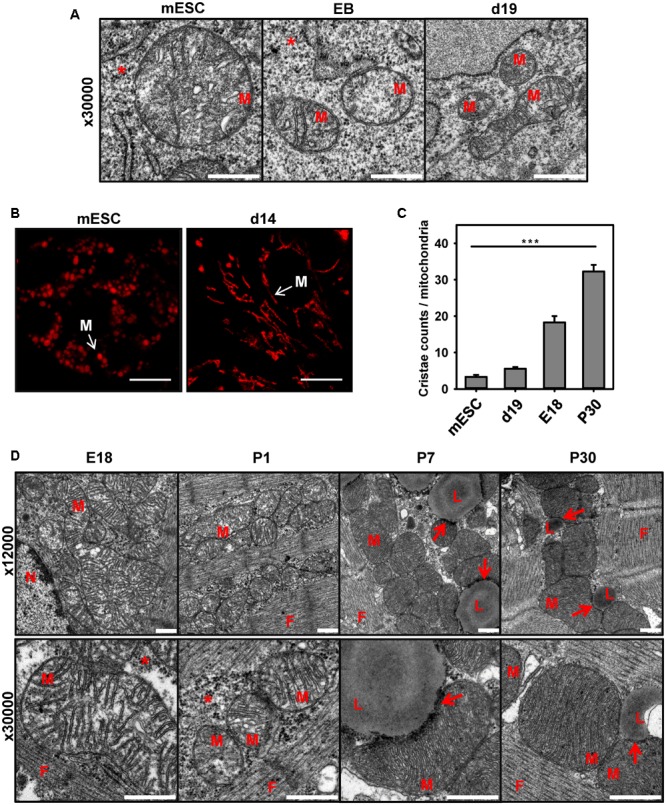
FIGURE 3.

Comparison of mitochondria shape and cristae during mESC differentiation to cardiomyocytes and heart development. (A) Representative electron microscopy pictures of mouse embryonic stem cells (mESC, left) embryo bodies (EB, middle) and mESC-derived CM at day 19 (d19, right). Detailed images of mitochondria at magnification 30000X are shown. Scale bar – 500 nm. (B) Representative TMRE fluorescence images of mESC and mESC-derived CM at d14. Scale bar - 10 μm. Pictures were taken from 2 to 3 independent differentiation experiments. (C) Quantification of cristae amount per mitochondria. Data are presented as mean values ± SEM, ∗∗∗p < 0.001. (D) Representative electron microscopy pictures of mitochondria heart tissue (magnification 12000× top, and 30000× bottom) in E18, newborn day 1 (P1), day 7 (P7) and adult day 30 (P30) mice. M, mitochondria; N, nucleus; L, lipid droplets; F, cardiac myofibrils; arrow - LD/Mitochondria contact; ∗ - glycogen. Embryos (E18) or postnatal (P1-30) heart tissue from at least two different animals were analyzed per group. Scale bar – 500 nm.
