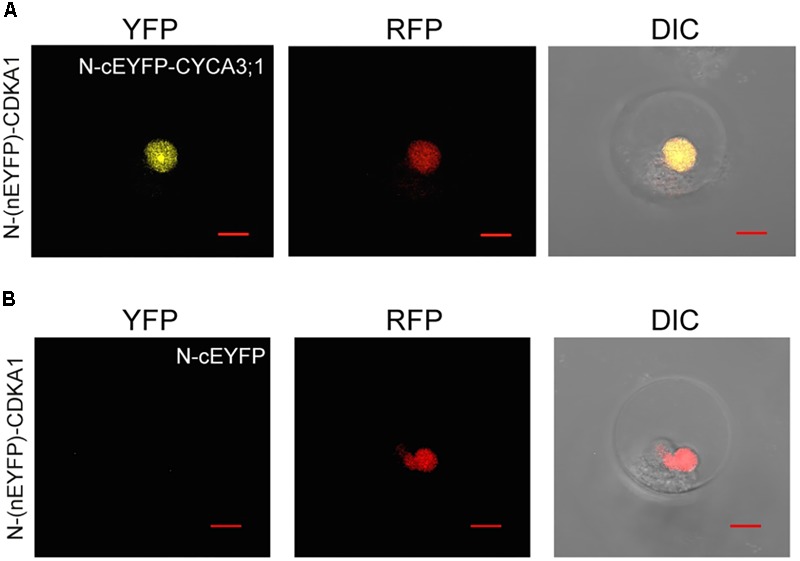
FIGURE 3.

Protein–protein interactions of CDKA1/CYCA3;1 proteins visualized using BiFC. (A) The BiFC signal was detected in protoplast cells co-transfected with N-(nEYFP)-CDKA1 and N-cEYFP-CYCA3;1 constructs. (B) No signal was detected in protoplast cells co-transfected with N-(nEYFP)-CDKA1 and N-cEYFP constructs. mCherry-VirD2NLS was used as a nuclear marker. DIC, differential interference contrast images of cells superimposed with YFP and RFP channels. Scale bar, 10 μm.
