
Figure 2.
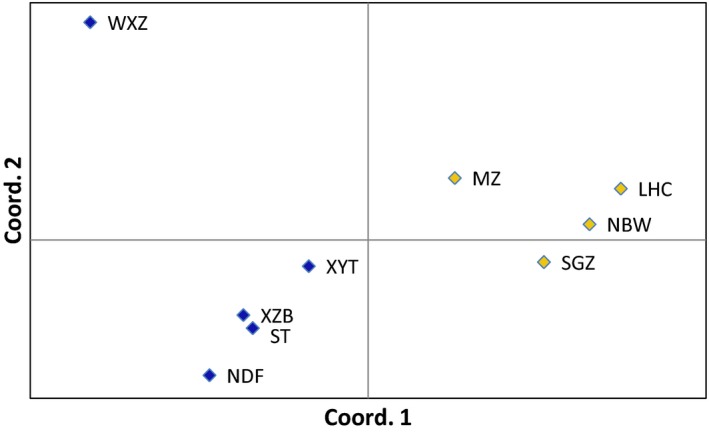
Principal coordinate analysis based on the genetic distance matrix of Fst values. Population codes are given in Table 1. Colors within the diamond: blue, high genetic diversity group; yellow, low genetic diversity group
Official websites use .gov
A
.gov website belongs to an official
government organization in the United States.
Secure .gov websites use HTTPS
A lock (
) or https:// means you've safely
connected to the .gov website. Share sensitive
information only on official, secure websites.
Principal coordinate analysis based on the genetic distance matrix of Fst values. Population codes are given in Table 1. Colors within the diamond: blue, high genetic diversity group; yellow, low genetic diversity group