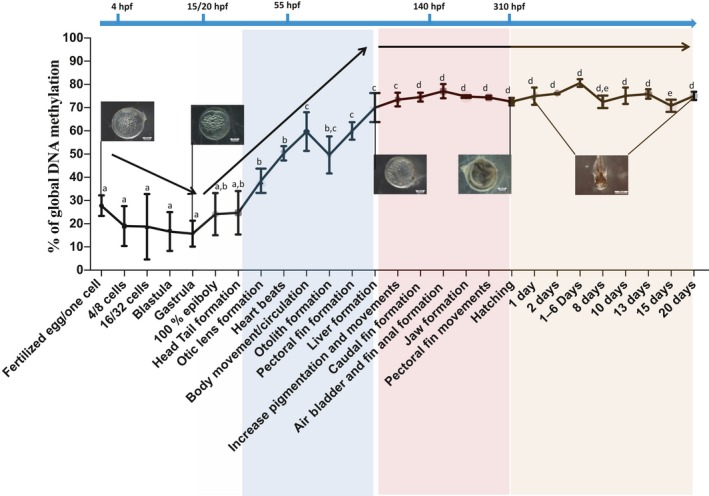
Figure 2.

CpG DNA methylation levels during the embryonic development of Kryptolebias marmoratus. The results are given for a quantity of 600 ng of genomic DNA using the LUminometric Methylation Assay (LUMA) and the corresponding name stages of the Figure 2. The developmental stages are indicated under the x‐axis. P values are given for Tukey's post hoc test after one‐way ANOVA if p < 0.05 threshold. Means labeled with the same letter do not display statistically significant differences
