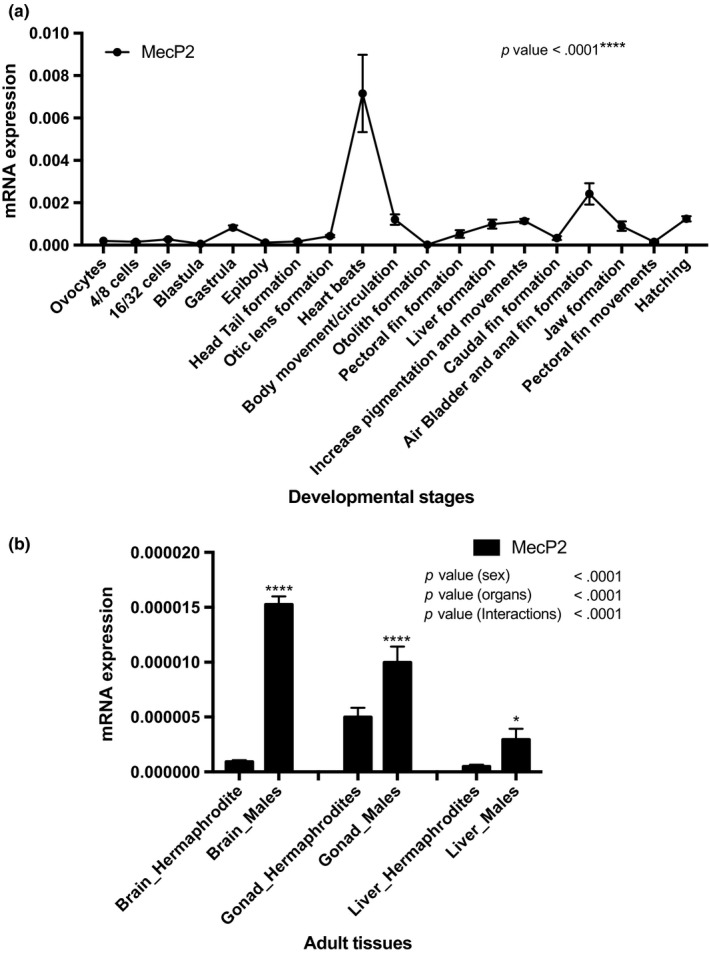
Figure 6.

mRNA expression of Rivulus MeCP2 genes during early stages and adult tissues of Kryptolebias marmoratus. (a) Expression levels relative to ß‐actin are given. The developmental stages are indicated under the x‐axis. P values are given for Tukey's post hoc test after one‐way ANOVA if p < .05 threshold. (b) Expression levels relative to 18S‐RNA are given. The adult tissues are indicated under the x‐axis. P values are given for Sidak's post hoc test after two‐way ANOVA if p < .05 threshold
