Figure 9.

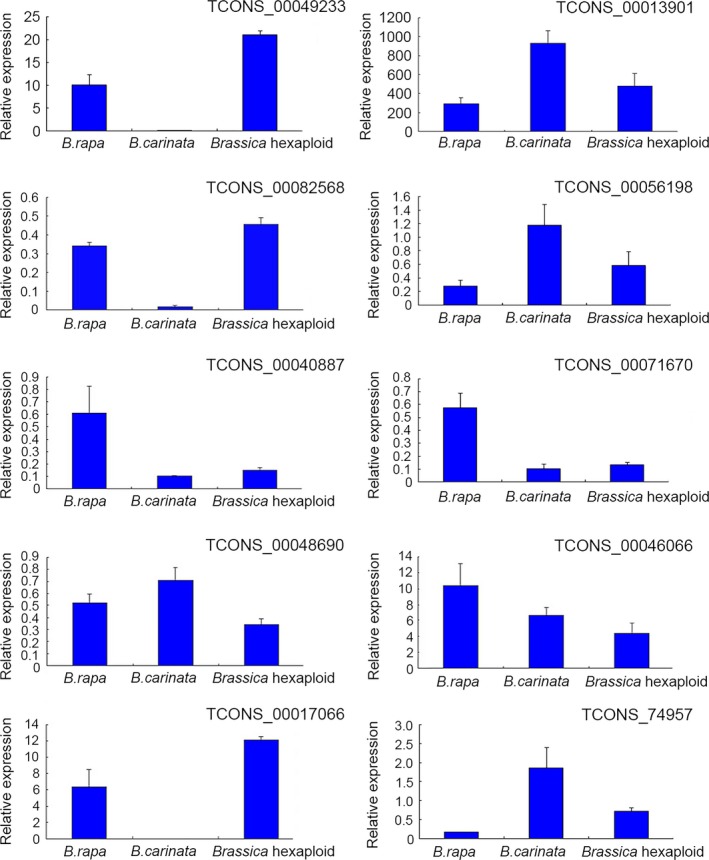
The relative expression levels of selected ten lncRNAs are validated by quantitative real‐time RT‐PCR. Error bars display the standard deviation of four replicates

The relative expression levels of selected ten lncRNAs are validated by quantitative real‐time RT‐PCR. Error bars display the standard deviation of four replicates