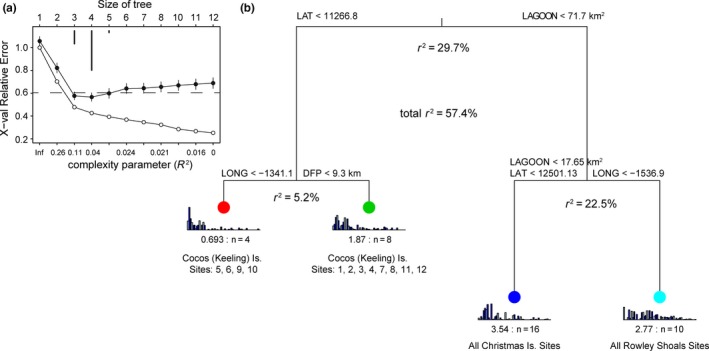
Figure 2.

Multivariate regression tree illustrating the role of measured spatial and environmental factors in influencing the structure of fish assemblages across the isolated reef systems of the NE Indian Ocean. (a) Relative error versus complexity parameter indicates a four‐leaf tree was the most parsimonious with 57.4% of variation explained. (b) Multiple explanatory variables were equally plausible at each split indicating that it was not possible to separate such effects from each other. For example, latitudinal differences and lagoon size were equally effective at explaining the observed groupings. Length of the vertical branches is directly proportional to the variance explained. Data were hellinger transformed, and Euclidean distance was used for splitting. Barplots at the bottom of the “leaves” indicate the abundance of species as they occur in the dataset. The colors at the nodes identify the groupings in the PCA biplots that accompany this analysis (Figure 3)
