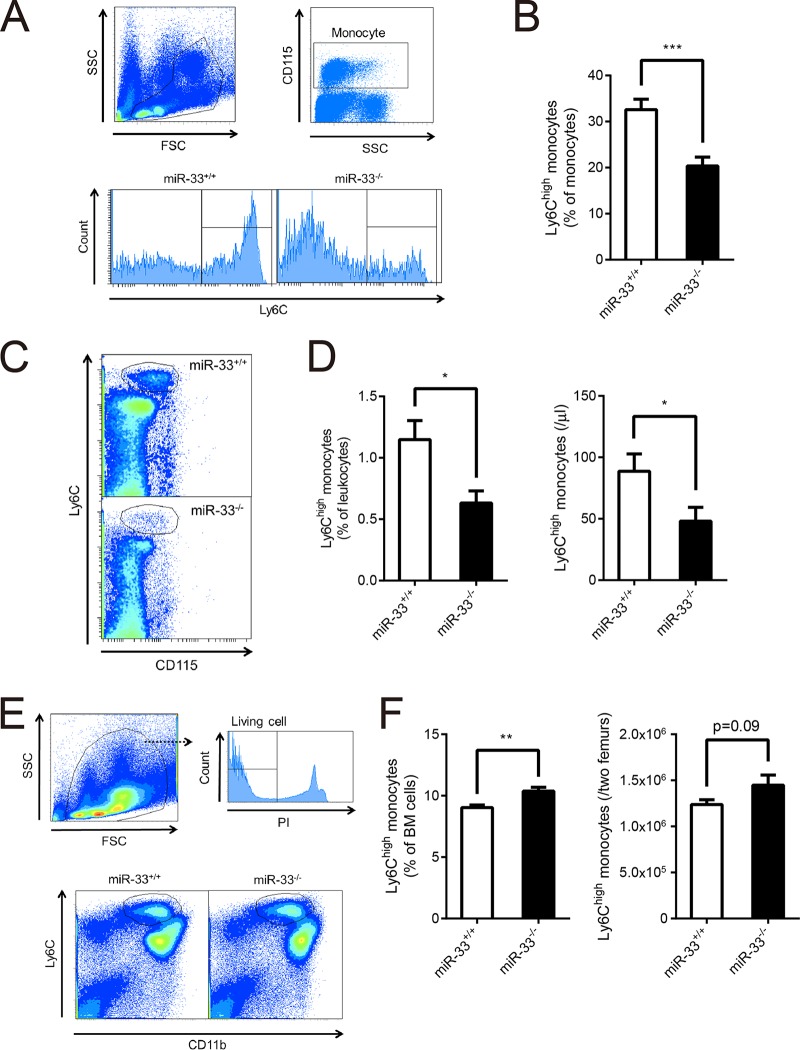
FIG 1.
Ly6Chigh monocytes in PB were decreased, and those in BM were increased in miR-33−/− mice. (A) Representative histograms of the proportion of Ly6Chigh monocytes in peripheral monocytes from miR-33+/+ and miR-33−/− mice. (B) The proportion of Ly6Chigh monocytes in peripheral monocytes from miR-33+/+ and miR-33−/− mice (miR-33+/+, n = 15 mice; miR-33−/−, n = 14 mice). (C) Representative dot plots of Ly6Chigh monocytes in PB from miR-33+/+ and miR-33−/− mice. (D) The proportion (left) and the number (right) of Ly6Chigh monocytes in PB from miR-33+/+ and miR-33−/− mice (miR-33+/+, n = 15 mice; miR-33−/−, n = 14 mice). (E) The scheme for gating of Ly6Chigh monocytes in BM and representative dot plots of Ly6Chigh monocytes in BM. (F) The proportion (left) and the number (right) of Ly6Chigh monocytes in BM from miR-33+/+ and miR-33−/− mice (n = 15 per group). All data are shown as means ± SEM. *, P < 0.05; **, P < 0.01, ***, P < 0.001 (by Student's t test). SSC, side scatter; FSC, forward scatter.

