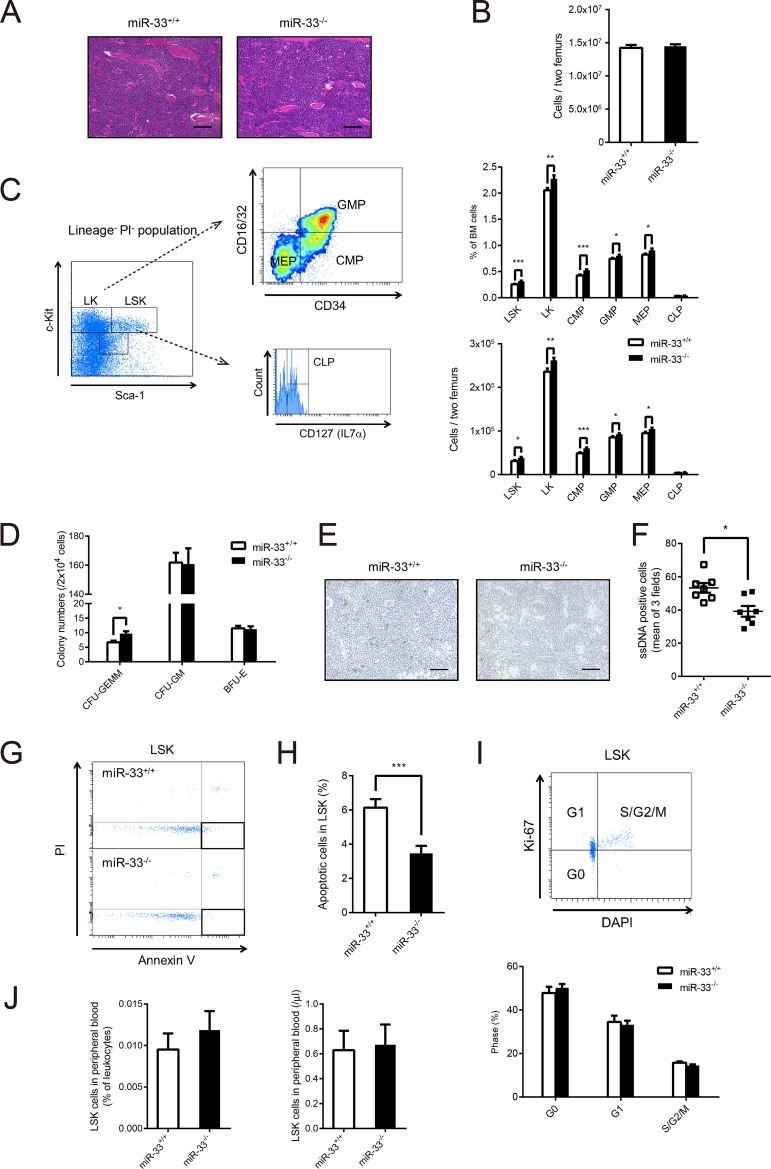
FIG 2.
miR-33 deficiency reduced apoptosis in LSK cells and increased in LSK cells and committed progenitor cells in BM. (A) Hematoxylin and eosin staining of BM from miR-33+/+ and miR-33−/− mice. Scale bars, 50 μm. (B) Total number of BM cells obtained from two femurs from miR-33+/+ and miR-33−/− mice (n = 28 per group). (C) The scheme for gating of LSK and LK cells and myeloid committed progenitor cells in BM, and the proportion (upper) and the number (bottom) of each cell population in miR-33+/+ and miR-33−/− mice (n = 18 to 28 per group). (D) The number of colonies, as indicated, grown from 2 × 10⁴ BM cells from miR-33+/+ and miR-33−/− mice (miR-33+/+, n = 12; miR-33−/−, n = 13 mice). GEMM, granulocyte, erythroid, macrophage, megakaryocyte; GM, granulocyte, macrophage; BFU-E, burst-forming unit-erythroid. (E) Representative microscopic images of single-stranded DNA staining of BM from miR-33+/+ and miR-33−/− mice. Scale bars, 50 μm. (F) The number of single-stranded DNA (ssDNA)-positive cells per field at a magnification of ×400 (each number is a mean of positive cells in three fields) (n = 7 per group). *, P < 0.05 (by Mann-Whitney U test). (G) Representative dot plots of apoptosis in LSK cells from miR-33+/+ and miR-33−/− mice. (H) The proportion of apoptosis in LSK cells from miR-33+/+ and miR-33−/− mice (n = 18 per group). (I) Representative dot plots of cell cycle analysis with DAPI and anti-Ki-67 antibody and the result of the cell cycle analysis of LSK cells from miR-33+/+ and miR-33−/− mice (n = 11 per group). (J) The proportion (left) and the number (right) of LSK cells in PB from miR-33+/+ and miR-33−/− mice (n = 10 per group). All data are shown as means ± SEM. *, P < 0.05; **, P < 0.01, ***, P < 0.001 (by Student's t test except for the data in panel F).

