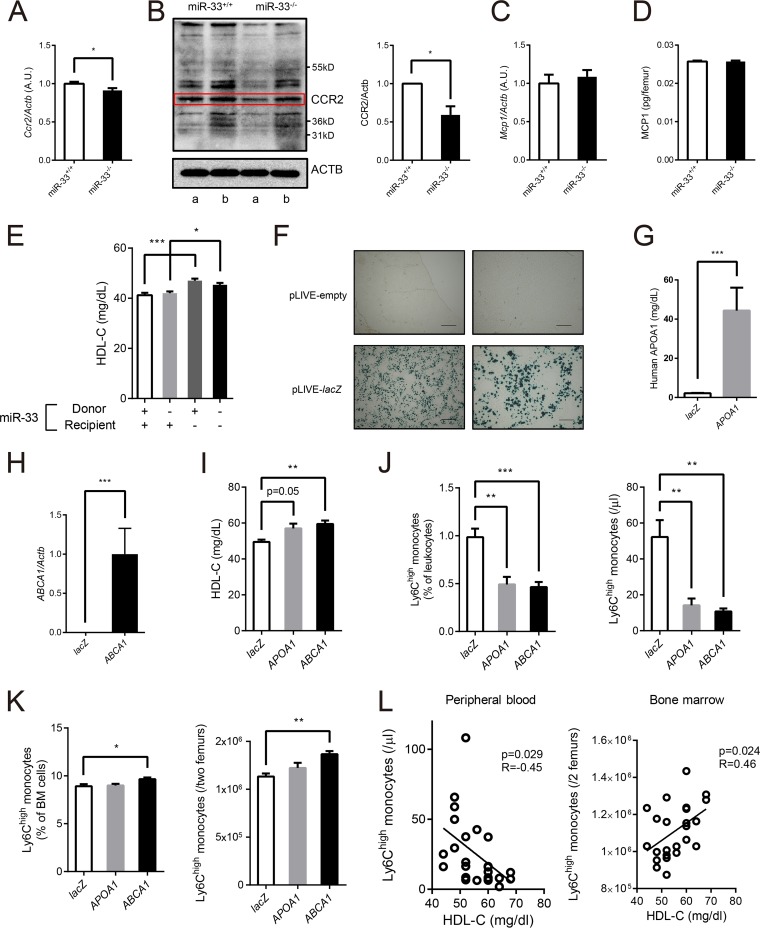
FIG 6.
Hepatic ABCA1 increased HDL-C and repressed the egress of Ly6Chigh monocytes from bone marrow. (A) Quantitative real-time PCR analysis of Ccr2 in Ly6Chigh monocytes in BM from miR-33+/+ and miR-33−/− mice (n = 12 per group). *, P < 0.05 (by Student's t test). AU, arbitrary units. (B) Representative Western blotting of CCR2 in Ly6Chigh monocytes in BM from miR-33+/+ and miR-33−/− mice (left) and densitometry of three independent experiments (right). Matching letters indicate samples from the same experiment, and each experiment was performed with mixed protein obtained from 4 mice (n = 4 per group). β-Actin was used as a loading control. *, P < 0.05 (by Student's t test). (C) Quantitative real-time PCR analysis of Mcp1 in whole BM cells obtained from miR-33+/+ and miR-33−/− mice (n = 6 per group). (D) MCP1 protein levels in one femur from miR-33+/+ and miR-33−/− mice assessed by ELISA (n = 6 per group). (E) Serum HDL-C levels in four groups of mice in the BMT experiment (n = 57 to 66 per group). *, P < 0.05; ***, P < 0.001 (by one-way ANOVA with a Turkey post hoc test). (F) β-Galactosidase staining of the liver of WT mice 2 days after injection of pLIVE-empty and pLIVE-lacZ vectors. Scale bars, 500 μm (left) and 200 μm (right). (G) Human APOA1 protein levels in PB from WT mice 3 weeks after injection of pLIVE-lacZ and pLIVE-APOA1 vectors assessed by ELISA (n = 8 per group). ***, P < 0.001 (by Mann-Whitney U test). (H) Quantitative real-time PCR analysis of human ABCA1 expression in the liver of WT mice at 3 weeks after injection of pLIVE-lacZ and pLIVE-ABCA1 vectors (n = 8 per group). ***, P < 0.001 (by Mann-Whitney U test). (I) Serum HDL-C levels in WT mice 2 weeks after injection of pLIVE-lacZ, pLIVE-APOA1, or pLIVE-ABCA1 (n = 8 per group). **, P < 0.01 (by Kruskal-Wallis test). (J) The proportion (left) and the number (right) of Ly6Chigh monocytes in PB in WT mice 3 weeks after injection of pLIVE-lacZ, pLIVE-APOA1, or pLIVE-ABCA1 (n = 8 per group). **, P < 0.01; ***, P < 0.001 (by Kruskal-Wallis test). (K) The proportion (left) and the number (right) of Ly6Chigh monocytes in BM in WT mice 3 weeks after injection of pLIVE-lacZ, pLIVE-APOA1, or pLIVE-ABCA1 (n = 8 per group). *, P < 0.05; **, P < 0.01 (by Kruskal-Wallis test). (L) Linear regression between serum HDL-C level and Ly6Chigh monocyte counts in PB and BM (n = 24). All data are shown as means ± SEM.

