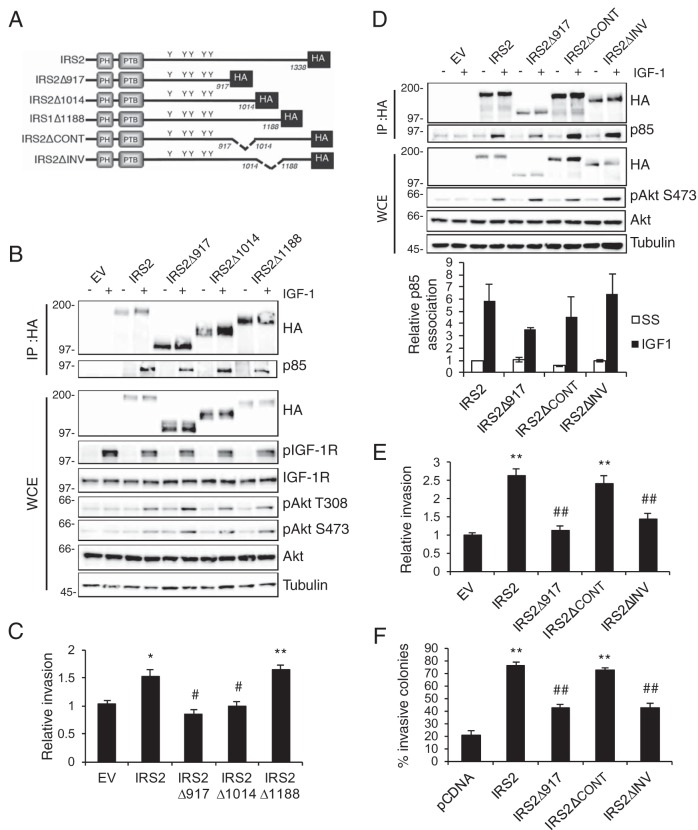
FIG 3.
Identification of a region in the IRS2 C-terminal tail that regulates tumor cell invasion. (A) Schematic of WT and mutant IRS2 proteins. (B) Cell extracts from PyMT:Irs1/2−/− cells stimulated with IGF-1 (50 ng/ml) for 10 min were immunoprecipitated with an HA-specific antibody and immunoblotted with antibodies specific for HA or the p85 subunit of PI3K. Whole-cell extracts were also immunoblotted with antibodies specific for HA, pAkt (S473), pAkt (T308), Akt, and tubulin. (C) Matrigel Transwell invasion assays. The data shown represent the means and SEM of the results of five independent experiments. (D) Cell extracts from PyMT:Irs1/2−/− cells stimulated with IGF-1 (50 ng/ml) for 10 min were immunoprecipitated with an HA-specific antibody and immunoblotted with antibodies specific for HA or the p85 subunit of PI3K. Whole-cell extracts were also immunoblotted with antibodies specific for HA, pAkt (S473), Akt, and tubulin. The data shown in the graph below represent the means and SEM of p85 association with the IRS proteins from three independent experiments. No statistical significance was observed among the groups. (E) Matrigel Transwell invasion assays. The data shown represent the means and SEM of the results of three experiments. (F) Matrigel-collagen I 3D invasion assay. The data shown represent the means and SEM of the results of a representative experiment performed three times independently. *, P < 0.05 relative to EV; **, P < 0.01 relative to EV; #, P < 0.05 relative to IRS2; ##, P < 0.01 relative to IRS2. Molecular weight markers (in kilodaltons) are indicated to the left of the immunoblots.

