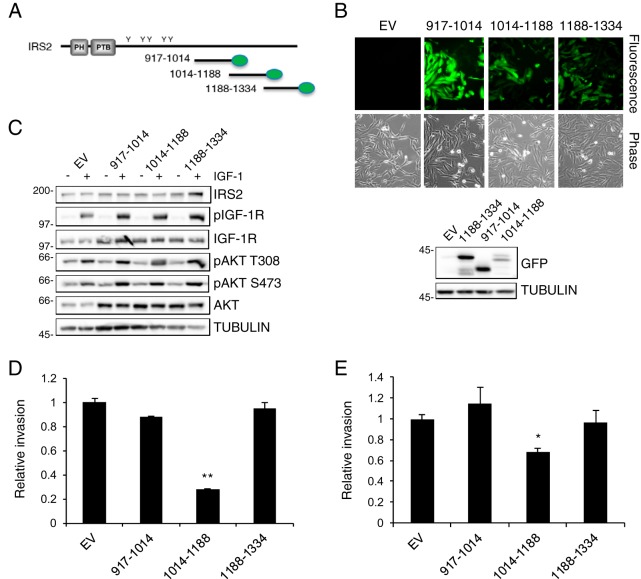
FIG 5.
The IRS2 INV region acts in a dominant-negative manner. (A) Schematic depicting the C-terminal regions of IRS2 tagged with mVenus (green ovals). (B) (Top) Fluorescence and phase contrast images of SUM-159 cells expressing the individual regions (magnification, ×10). (Bottom) Whole-cell extracts were immunoblotted with antibodies specific for GFP and tubulin. (C) Cell extracts from SUM-159 cells expressing the IRS2 C-terminal regions and stimulated with IGF-1 (50 ng/ml) for 10 min were immunoblotted with antibodies specific for IRS2, pIGF-1R (Y1135/1136), IGF-1R, pAKT (T308), pAKT (S473), AKT, and tubulin. (D and E) SUM-159 cells (D) and MDA-MB-231 cells (E) expressing the IRS2 C-terminal regions were evaluated for invasion by Matrigel Transwell invasion assay. The data shown represent the means and SEM of the results of three independent experiments. *, P < 0.05 relative to EV; **, P < 0.01 relative to EV. Molecular weight markers (in kilodaltons) are indicated to the left of the immunoblots.

